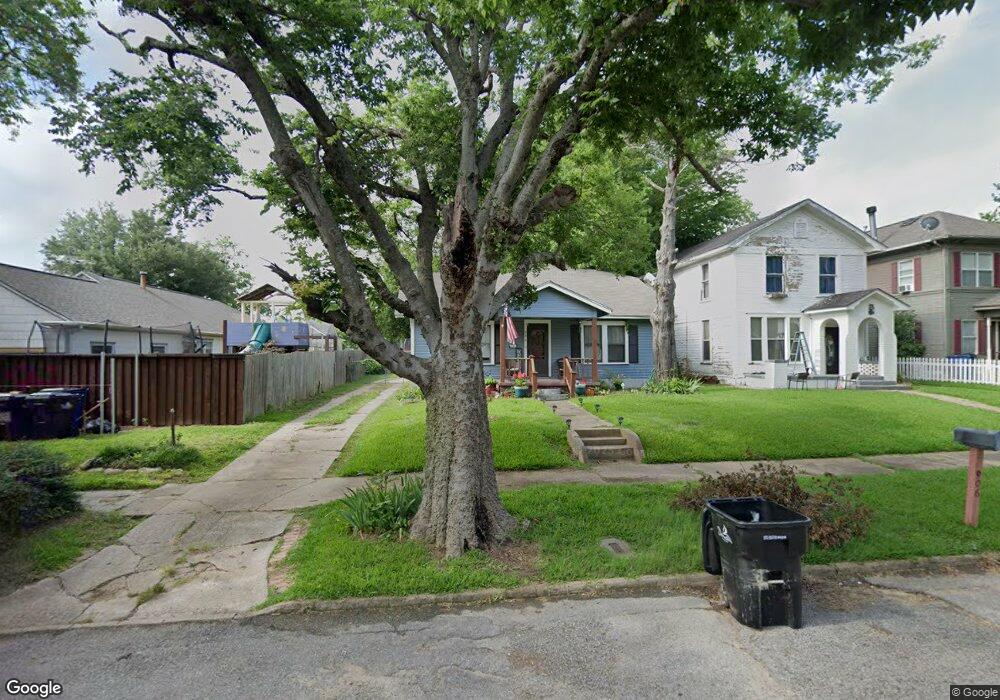
906 W Bond St Denison, TX 75020
Estimated Value: $159,000 - $179,714
3
Beds
1
Bath
1,608
Sq Ft
$105/Sq Ft
Est. Value
About This Home
This home is located at 906 W Bond St, Denison, TX 75020 and is currently estimated at $169,357, approximately $105 per square foot. 906 W Bond St is a home located in Grayson County with nearby schools including Terrell Elementary School, Scott Middle School, and Denison High School.
Ownership History
Date
Name
Owned For
Owner Type
Purchase Details
Closed on
May 25, 2010
Sold by
The First National Bank Of Tom Bean
Bought by
Stephens Jason T and Stephens Christina J
Current Estimated Value
Home Financials for this Owner
Home Financials are based on the most recent Mortgage that was taken out on this home.
Original Mortgage
$97,115
Outstanding Balance
$64,933
Interest Rate
5%
Mortgage Type
Seller Take Back
Estimated Equity
$104,424
Create a Home Valuation Report for This Property
The Home Valuation Report is an in-depth analysis detailing your home's value as well as a comparison with similar homes in the area
Home Values in the Area
Average Home Value in this Area
Purchase History
| Date | Buyer | Sale Price | Title Company |
|---|---|---|---|
| Stephens Jason T | -- | Chapin Title Co Inc |
Source: Public Records
Mortgage History
| Date | Status | Borrower | Loan Amount |
|---|---|---|---|
| Open | Stephens Jason T | $97,115 |
Source: Public Records
Tax History Compared to Growth
Tax History
| Year | Tax Paid | Tax Assessment Tax Assessment Total Assessment is a certain percentage of the fair market value that is determined by local assessors to be the total taxable value of land and additions on the property. | Land | Improvement |
|---|---|---|---|---|
| 2025 | $1,280 | $119,625 | -- | -- |
| 2024 | $2,527 | $108,750 | $0 | $0 |
| 2023 | $1,012 | $98,864 | $0 | $0 |
| 2022 | $2,135 | $89,876 | $0 | $0 |
| 2021 | $2,061 | $81,705 | $20,250 | $61,455 |
| 2020 | $2,206 | $83,649 | $15,000 | $68,649 |
| 2019 | $2,267 | $82,393 | $12,450 | $69,943 |
| 2018 | $2,256 | $81,305 | $7,800 | $73,505 |
| 2017 | $1,867 | $66,728 | $6,975 | $59,753 |
| 2016 | $1,692 | $60,491 | $4,200 | $56,291 |
| 2015 | $1,313 | $46,468 | $1,650 | $44,818 |
| 2014 | $1,313 | $46,468 | $1,650 | $44,818 |
Source: Public Records
Map
Nearby Homes
- 1001 W Morton St
- 1008 W Walker St
- 917 W Sears St
- 911 W Sears St
- 829 W Sears St
- 827 W Walker St
- 825 W Walker St
- 1015 W Walker St
- 1104 W Bond St
- 801 W Walker St
- 728 W Walker St
- 1114 W Walker St
- 1111 W Sears St
- 1123 W Sears St
- 1031 W Gandy St
- 1119 W Johnson St
- 624 W Walker St
- 629 W Walker St
- 811 W Woodard St
- 720 W Gandy St