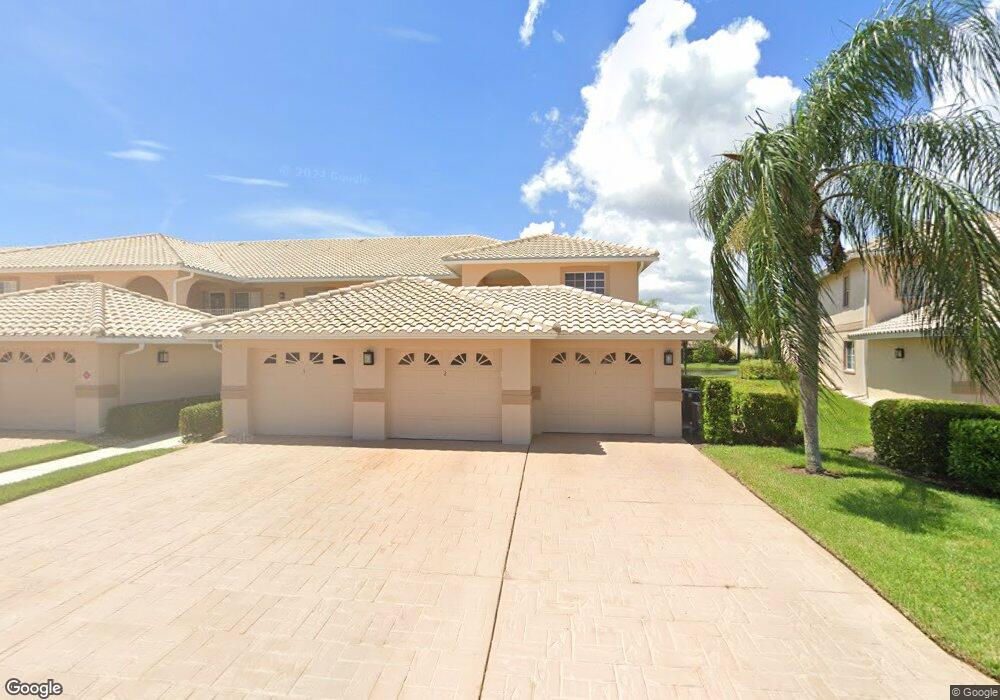
9061 Michael Cir Unit 501 Naples, FL 34113
Lely Resort NeighborhoodEstimated Value: $387,000 - $422,000
3
Beds
2
Baths
1,450
Sq Ft
$278/Sq Ft
Est. Value
About This Home
This home is located at 9061 Michael Cir Unit 501, Naples, FL 34113 and is currently estimated at $402,672, approximately $277 per square foot. 9061 Michael Cir Unit 501 is a home located in Collier County with nearby schools including Lely Elementary School, Manatee Middle School, and Lely High School.
Ownership History
Date
Name
Owned For
Owner Type
Purchase Details
Closed on
Feb 2, 2012
Sold by
Kinnon Jack and Kinnon Krystyna
Bought by
Kinnon Jack and Kinnon Krystyna
Current Estimated Value
Purchase Details
Closed on
Dec 22, 2010
Sold by
Strobel Nancy S and Strobel Richard
Bought by
Kinnon Jack and Kinnon Krystyna
Purchase Details
Closed on
Mar 16, 2005
Sold by
Wenz Clifford J and Wenz Marilyn
Bought by
Boyd Bruce
Home Financials for this Owner
Home Financials are based on the most recent Mortgage that was taken out on this home.
Original Mortgage
$266,000
Interest Rate
5.54%
Mortgage Type
Purchase Money Mortgage
Purchase Details
Closed on
Oct 10, 1996
Sold by
Royalty Dev Corp
Bought by
Wenz Clifford J
Home Financials for this Owner
Home Financials are based on the most recent Mortgage that was taken out on this home.
Original Mortgage
$95,800
Interest Rate
7.87%
Create a Home Valuation Report for This Property
The Home Valuation Report is an in-depth analysis detailing your home's value as well as a comparison with similar homes in the area
Home Values in the Area
Average Home Value in this Area
Purchase History
| Date | Buyer | Sale Price | Title Company |
|---|---|---|---|
| Kinnon Jack | -- | Attorney | |
| Kinnon Jack | $165,000 | None Available | |
| Boyd Bruce | $280,000 | First American Title Co | |
| Wenz Clifford J | -- | -- |
Source: Public Records
Mortgage History
| Date | Status | Borrower | Loan Amount |
|---|---|---|---|
| Previous Owner | Boyd Bruce | $266,000 | |
| Previous Owner | Wenz Clifford J | $95,800 |
Source: Public Records
Tax History Compared to Growth
Tax History
| Year | Tax Paid | Tax Assessment Tax Assessment Total Assessment is a certain percentage of the fair market value that is determined by local assessors to be the total taxable value of land and additions on the property. | Land | Improvement |
|---|---|---|---|---|
| 2025 | $4,038 | $320,734 | -- | -- |
| 2024 | $3,935 | $291,576 | -- | -- |
| 2023 | $3,935 | $265,069 | $0 | $0 |
| 2022 | $3,612 | $240,972 | $0 | $0 |
| 2021 | $3,318 | $219,065 | $0 | $0 |
| 2020 | $3,049 | $199,150 | $0 | $199,150 |
| 2019 | $2,999 | $193,350 | $0 | $193,350 |
| 2018 | $2,946 | $189,000 | $0 | $189,000 |
| 2017 | $2,904 | $189,000 | $0 | $189,000 |
| 2016 | $2,760 | $179,891 | $0 | $0 |
| 2015 | $2,611 | $163,537 | $0 | $0 |
| 2014 | $2,402 | $148,670 | $0 | $0 |
Source: Public Records
Map
Nearby Homes
- 9061 Michael Cir Unit 2
- 9060 Michael Cir Unit 4-407
- 9060 Michael Cir Unit 2
- 9035 Michael Cir Unit 5
- 9087 Michael Cir Unit 9
- 9113 Michael Cir Unit 7
- 9113 Michael Cir Unit 9
- 9113 Michael Cir Unit 12
- 9165 Michael Cir Unit 1002
- 8580 Mystic Greens Way Unit 602
- 8975 Morgan Ct
- 8515 Mystic Greens Way Unit 106
- 8480 Mystic Greens Way Unit 803
- 8526 Mustang Dr
- 8440 Mystic Greens Way Unit 1001
- 9061 Michael Cir Unit 12
- 9061 Michael Cir Unit 5-504
- 9061 Michael Cir Unit 5-512
- 9061 Michael Cir Unit 5
- 9061 Michael Cir Unit 5-7
- 9061 Michael Cir Unit 5-506
- 9061 Michael Cir Unit 5-507
- 9061 Michael Cir Unit 5-511
- 9061 Michael Cir Unit 7
- 9061 Michael Cir Unit 512
- 9061 Michael Cir Unit 511
- 9061 Michael Cir Unit 510
- 9061 Michael Cir Unit 508
- 9061 Michael Cir Unit 507
- 9061 Michael Cir Unit 506
- 9061 Michael Cir Unit 505
- 9061 Michael Cir Unit 504
- 9061 Michael Cir Unit 503
- 9061 Michael Cir Unit 502
- 9061 Michael Cir Unit 509