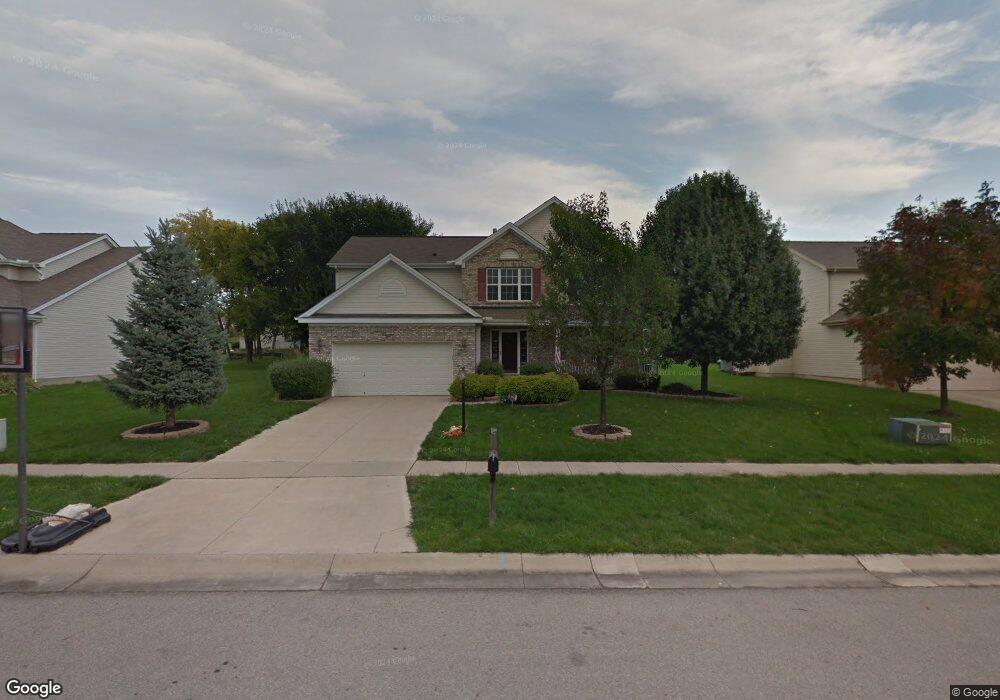
9064 Summit View Ct Springboro, OH 45066
Estimated Value: $417,524 - $463,000
4
Beds
3
Baths
2,432
Sq Ft
$185/Sq Ft
Est. Value
About This Home
This home is located at 9064 Summit View Ct, Springboro, OH 45066 and is currently estimated at $450,631, approximately $185 per square foot. 9064 Summit View Ct is a home located in Warren County with nearby schools including Clearcreek Elementary School, Springboro Intermediate School, and Springboro Junior High School.
Ownership History
Date
Name
Owned For
Owner Type
Purchase Details
Closed on
Dec 30, 2008
Sold by
Lamb Scott
Bought by
Skipper Jane E and Skipper Andrew W
Current Estimated Value
Home Financials for this Owner
Home Financials are based on the most recent Mortgage that was taken out on this home.
Original Mortgage
$232,926
Outstanding Balance
$146,750
Interest Rate
5.53%
Mortgage Type
FHA
Estimated Equity
$303,881
Purchase Details
Closed on
Jun 27, 2002
Sold by
Inverness Group
Bought by
Lamb Scott
Home Financials for this Owner
Home Financials are based on the most recent Mortgage that was taken out on this home.
Original Mortgage
$200,275
Interest Rate
6.93%
Mortgage Type
New Conventional
Purchase Details
Closed on
Feb 8, 2002
Sold by
Summit Pointe Investors
Bought by
Inverness Group
Create a Home Valuation Report for This Property
The Home Valuation Report is an in-depth analysis detailing your home's value as well as a comparison with similar homes in the area
Home Values in the Area
Average Home Value in this Area
Purchase History
| Date | Buyer | Sale Price | Title Company |
|---|---|---|---|
| Skipper Jane E | $236,000 | Triad Title | |
| Lamb Scott | $210,828 | -- | |
| Inverness Group | $38,500 | -- |
Source: Public Records
Mortgage History
| Date | Status | Borrower | Loan Amount |
|---|---|---|---|
| Open | Skipper Jane E | $232,926 | |
| Closed | Lamb Scott | $200,275 |
Source: Public Records
Tax History
| Year | Tax Paid | Tax Assessment Tax Assessment Total Assessment is a certain percentage of the fair market value that is determined by local assessors to be the total taxable value of land and additions on the property. | Land | Improvement |
|---|---|---|---|---|
| 2025 | $5,000 | $122,650 | $35,000 | $87,650 |
| 2024 | $5,000 | $122,650 | $35,000 | $87,650 |
| 2023 | $4,420 | $99,235 | $21,525 | $77,710 |
| 2022 | $4,350 | $99,236 | $21,525 | $77,711 |
| 2021 | $4,097 | $99,236 | $21,525 | $77,711 |
| 2020 | $3,855 | $80,679 | $17,500 | $63,179 |
| 2019 | $3,577 | $80,679 | $17,500 | $63,179 |
| 2018 | $3,524 | $80,679 | $17,500 | $63,179 |
| 2017 | $3,477 | $70,508 | $15,533 | $54,975 |
| 2016 | $3,602 | $70,508 | $15,533 | $54,975 |
| 2015 | $3,568 | $70,508 | $15,533 | $54,975 |
| 2014 | $3,598 | $67,150 | $14,790 | $52,360 |
| 2013 | $3,597 | $79,420 | $17,500 | $61,920 |
Source: Public Records
Map
Nearby Homes
- 9079 Bunnell Hill Rd
- 9175 Bunnell Hill Rd
- 9229 Bennington Way
- 9195 Glenridge Blvd
- 9048 Bedford Ct
- 15 Pembrook Dr
- 40 Millbrook Ct
- 25 Sandelwood St
- 8638 Sycamore Trails Dr
- 8301 Red Lion 5 Points Rd
- 9823 Scotch Pine Dr
- 811 Wind Bluff Point
- 135 Winding Creek Dr
- 8711 Nicole Ln
- 1198 Normandy Rue
- 9155 Remy Ct
- 701 Grand Wood Ct
- 1211 Normandy Rue
- 9197 Remy Ct
- 85 Pebble Brook Place
- 9048 Summit View Ct
- 9076 Summit View Ct
- 9053 Summit Pointe Dr
- 9039 Summit Pointe Dr
- 9034 Summit View Ct
- 454 Hillcrest Dr
- 9021 Summit Pointe Dr
- 112 Bentridge Dr
- 3611 Summit Creek Dr
- 3619 Summit Creek Dr
- 3610 Summit Creek Dr
- 363 Summit Creek Dr
- 513 Hillcrest Dr
- 9054 Summit Pointe Dr
- 126 Bentridge Dr
- 9040 Summit Pointe Dr
- 9070 Summit Pointe Dr
- 9022 Summit Pointe Dr
- 55 E Lytle 5 Points Rd
- 9025 Bunnell Hill Rd
Your Personal Tour Guide
Ask me questions while you tour the home.