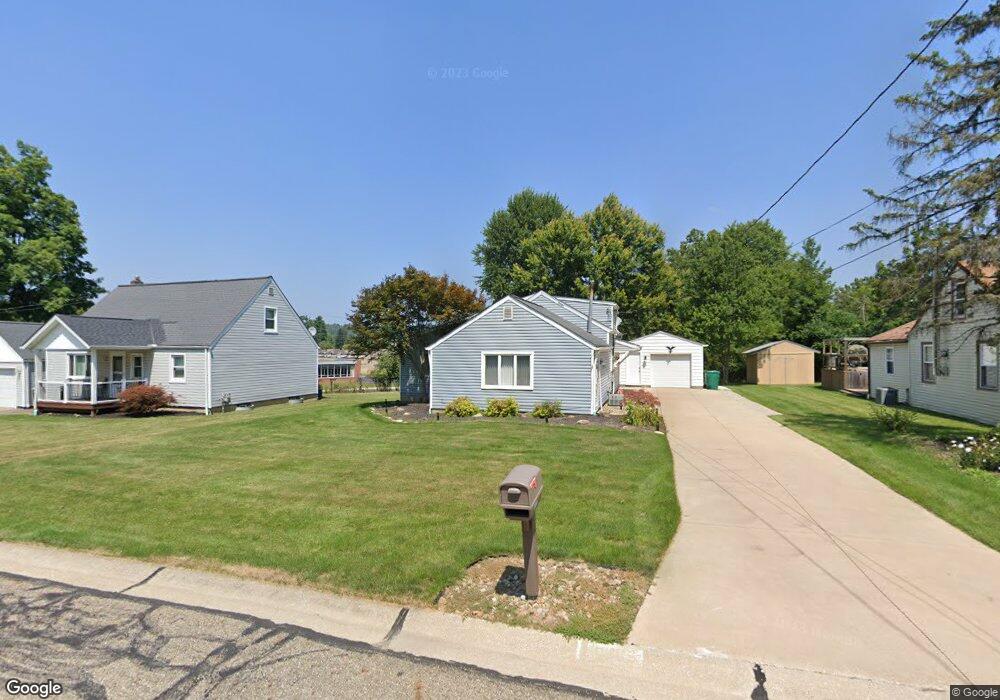
9065 Charles Ct Twinsburg, OH 44087
Estimated Value: $223,000 - $286,000
3
Beds
2
Baths
1,488
Sq Ft
$171/Sq Ft
Est. Value
About This Home
This home is located at 9065 Charles Ct, Twinsburg, OH 44087 and is currently estimated at $254,283, approximately $170 per square foot. 9065 Charles Ct is a home located in Summit County with nearby schools including Wilcox Primary School, Dodge Intermediate School, and Samuel Bissell Elementary School.
Ownership History
Date
Name
Owned For
Owner Type
Purchase Details
Closed on
May 5, 2010
Sold by
Bruckman Jennifer L
Bought by
Taylor Kurt and Taylor Susan
Current Estimated Value
Home Financials for this Owner
Home Financials are based on the most recent Mortgage that was taken out on this home.
Original Mortgage
$100,000
Outstanding Balance
$33,002
Interest Rate
5.05%
Mortgage Type
New Conventional
Estimated Equity
$221,281
Purchase Details
Closed on
Oct 22, 2007
Sold by
Boyle Dennis J
Bought by
Bruckman Jennifer L
Home Financials for this Owner
Home Financials are based on the most recent Mortgage that was taken out on this home.
Original Mortgage
$123,500
Interest Rate
6.33%
Mortgage Type
Purchase Money Mortgage
Purchase Details
Closed on
Jul 11, 2001
Sold by
Munn John W and Furka John M
Bought by
Boyle Dennis J
Home Financials for this Owner
Home Financials are based on the most recent Mortgage that was taken out on this home.
Original Mortgage
$87,210
Interest Rate
7.14%
Mortgage Type
FHA
Purchase Details
Closed on
Nov 1, 2000
Sold by
Munn Ralph W and Munn Joan M
Bought by
Munn Ralph W
Create a Home Valuation Report for This Property
The Home Valuation Report is an in-depth analysis detailing your home's value as well as a comparison with similar homes in the area
Home Values in the Area
Average Home Value in this Area
Purchase History
| Date | Buyer | Sale Price | Title Company |
|---|---|---|---|
| Taylor Kurt | $128,000 | Attorney | |
| Bruckman Jennifer L | $130,000 | Chicago Title Insurance Co | |
| Boyle Dennis J | $87,900 | -- | |
| Munn Ralph W | -- | -- |
Source: Public Records
Mortgage History
| Date | Status | Borrower | Loan Amount |
|---|---|---|---|
| Open | Taylor Kurt | $100,000 | |
| Closed | Bruckman Jennifer L | $123,500 | |
| Previous Owner | Boyle Dennis J | $87,210 |
Source: Public Records
Tax History Compared to Growth
Tax History
| Year | Tax Paid | Tax Assessment Tax Assessment Total Assessment is a certain percentage of the fair market value that is determined by local assessors to be the total taxable value of land and additions on the property. | Land | Improvement |
|---|---|---|---|---|
| 2025 | $2,952 | $61,324 | $13,552 | $47,772 |
| 2024 | $2,952 | $61,324 | $13,552 | $47,772 |
| 2023 | $2,952 | $61,324 | $13,552 | $47,772 |
| 2022 | $2,407 | $44,590 | $9,681 | $34,909 |
| 2021 | $2,418 | $44,590 | $9,681 | $34,909 |
| 2020 | $2,345 | $44,590 | $9,680 | $34,910 |
| 2019 | $2,401 | $42,690 | $5,910 | $36,780 |
| 2018 | $2,353 | $42,690 | $5,910 | $36,780 |
| 2017 | $2,130 | $42,690 | $5,910 | $36,780 |
| 2016 | $2,117 | $40,950 | $5,910 | $35,040 |
| 2015 | $2,130 | $40,950 | $5,910 | $35,040 |
| 2014 | $2,126 | $40,950 | $5,910 | $35,040 |
| 2013 | $2,137 | $41,200 | $5,910 | $35,290 |
Source: Public Records
Map
Nearby Homes
- 2869 Tinkers Ln
- 2607 Burridge Cir Unit M29
- 10000 Ravenna Rd
- 2619 E Aurora Rd
- 2708 Edgebrook Crossing Unit 19
- 10413 Fox Hollow Cir
- 2825 Veron Ln
- V/L- Eton St
- 2055 Rugby St
- 2064 Case St
- 2590 Post Rd
- 3284 Cannon Rd
- 3281 Evans Way
- 1959 Rugby St
- 2051 Presidential Pkwy
- 9740 Burton Dr
- 1897 Case St
- 2015 Presidential Pkwy Unit G60
- 3110 Blue Jaye Ln
- 2668 Walton Blvd
- 9071 Charles Ct
- 9063 Charles Ct
- 9059 Charles Ct
- 9052 Charles Ct
- 9052 Charles Ct
- 9062 Charles Ct
- 30 Jude Cir
- 23 Jude Cir
- 22 Jude Cir
- 8138 Megan Meadows Dr
- 9076 Charles Ct
- 9044 Charles Ct
- 2709 Richner Ct
- 80 S/L Megan Meadow Dr
- 39 S/L Meagan Meadow Dr
- 9028 Charles Ct
- 9156 Darrow Rd
- 2704 Richner Ct
- 62 Shady Timber Dr
- 60 Shady Timber Dr