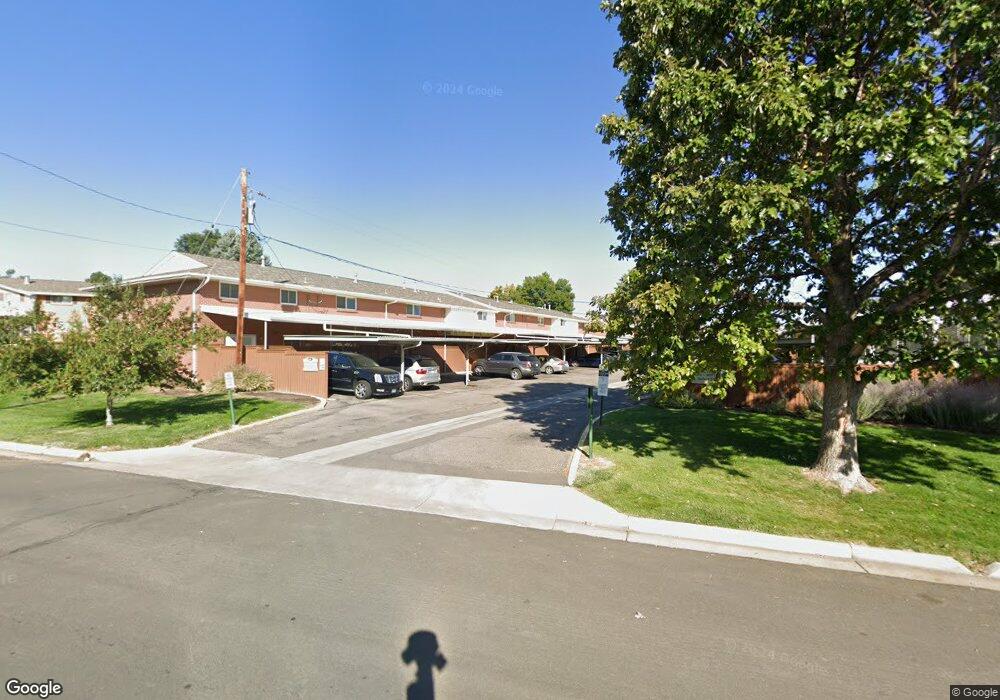
9065 E Oxford Dr Unit 608 Denver, CO 80237
Hampden South NeighborhoodEstimated Value: $361,666 - $423,000
4
Beds
4
Baths
2,160
Sq Ft
$181/Sq Ft
Est. Value
About This Home
This home is located at 9065 E Oxford Dr Unit 608, Denver, CO 80237 and is currently estimated at $390,417, approximately $180 per square foot. 9065 E Oxford Dr Unit 608 is a home located in Denver County with nearby schools including Samuels Elementary School, Holm Elementary School, and Joe Shoemaker School.
Ownership History
Date
Name
Owned For
Owner Type
Purchase Details
Closed on
Sep 22, 2021
Sold by
Worford Beverly J and Worford Richard L
Bought by
Chinarado Llc
Current Estimated Value
Purchase Details
Closed on
Aug 7, 2008
Sold by
Wells Fargo Bank Na
Bought by
Worford Beverly J
Purchase Details
Closed on
Aug 1, 2008
Sold by
Worford Beverly J
Bought by
Worford Beverly J and Worford Richard L
Purchase Details
Closed on
Jul 8, 2008
Sold by
Neiberger Deirdre D
Bought by
Wells Fargo Bank Na and Option One Mortgage Loan Trust 2007-Fxd1
Purchase Details
Closed on
Oct 30, 2006
Sold by
Shiner Carolyn A and Gelt Tina Rae
Bought by
Neiberger Deirdre D
Home Financials for this Owner
Home Financials are based on the most recent Mortgage that was taken out on this home.
Original Mortgage
$165,000
Interest Rate
6.28%
Mortgage Type
Purchase Money Mortgage
Create a Home Valuation Report for This Property
The Home Valuation Report is an in-depth analysis detailing your home's value as well as a comparison with similar homes in the area
Home Values in the Area
Average Home Value in this Area
Purchase History
| Date | Buyer | Sale Price | Title Company |
|---|---|---|---|
| Chinarado Llc | -- | None Available | |
| Worford Beverly J | $149,000 | Security Title | |
| Worford Beverly J | -- | Security Title | |
| Wells Fargo Bank Na | -- | None Available | |
| Neiberger Deirdre D | $175,000 | Land Title Guarantee Company |
Source: Public Records
Mortgage History
| Date | Status | Borrower | Loan Amount |
|---|---|---|---|
| Previous Owner | Neiberger Deirdre D | $165,000 |
Source: Public Records
Tax History
| Year | Tax Paid | Tax Assessment Tax Assessment Total Assessment is a certain percentage of the fair market value that is determined by local assessors to be the total taxable value of land and additions on the property. | Land | Improvement |
|---|---|---|---|---|
| 2025 | $2,020 | $25,210 | $4,550 | $4,550 |
| 2024 | $2,020 | $25,500 | $3,040 | $22,460 |
| 2023 | $1,976 | $25,500 | $3,040 | $22,460 |
| 2022 | $1,867 | $23,480 | $3,150 | $20,330 |
| 2021 | $1,802 | $24,150 | $3,240 | $20,910 |
| 2020 | $1,617 | $21,800 | $3,240 | $18,560 |
| 2019 | $1,572 | $21,800 | $3,240 | $18,560 |
| 2018 | $1,369 | $17,700 | $3,260 | $14,440 |
| 2017 | $1,365 | $17,700 | $3,260 | $14,440 |
| 2016 | $1,378 | $16,900 | $3,184 | $13,716 |
| 2015 | $1,320 | $16,900 | $3,184 | $13,716 |
| 2014 | $1,004 | $12,090 | $4,529 | $7,561 |
Source: Public Records
Map
Nearby Homes
- 9055 E Nassau Ave Unit 373
- 9051 E Nassau Ave Unit 375
- 9049 E Nassau Ave Unit 376
- 4301 S Alton Place
- 9194 E Nassau Ave
- 8895 E Radcliff Ave
- 9089 E Nassau Ave Unit 356
- 3948 S Yosemite St Unit 431
- 3981 S Boston St Unit 286
- 9004 E Mansfield Ave Unit 456
- 4080 S Vincennes Ct
- 9133 E Mansfield Ave Unit 81
- 9041 E Mansfield Ave Unit 106
- 3816 S Yosemite St Unit 139
- 8005 E Princeton Ave
- 9481 E Mansfield Ave Unit 207
- 9481 E Mansfield Ave Unit 303
- 9481 E Mansfield Ave Unit 305
- 8407 E Lehigh Dr
- 4505 S Yosemite St Unit 371
- 9063 E Oxford Dr Unit 607
- 9067 E Oxford Dr
- 9061 E Oxford Dr
- 9069 E Oxford Dr
- 9059 E Oxford Dr
- 9011 E Oxford Dr
- 9055 E Oxford Dr
- 9015 E Oxford Dr Unit 502
- 9009 E Oxford Dr
- 9007 E Oxford Dr
- 9021 E Oxford Dr
- 9005 E Oxford Dr Unit 498
- 9073 E Oxford Dr Unit 601
- 9077 E Oxford Dr Unit 599
- 9075 E Oxford Dr
- 9071 E Oxford Dr Unit 602
- 9023 E Oxford Dr Unit 506
- 9079 E Oxford Dr Unit 598
- 9003 E Oxford Dr
- 9081 E Oxford Dr
Your Personal Tour Guide
Ask me questions while you tour the home.