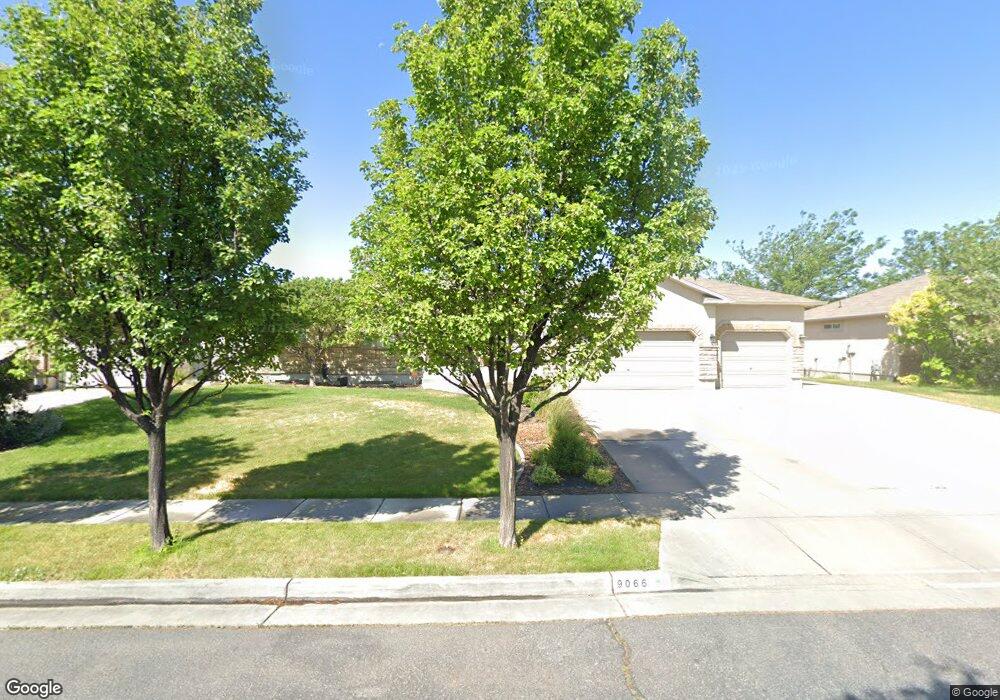
9066 S Mountain Iris Way West Jordan, UT 84081
Copper Hills NeighborhoodEstimated Value: $673,000 - $732,000
6
Beds
4
Baths
3,139
Sq Ft
$223/Sq Ft
Est. Value
About This Home
This home is located at 9066 S Mountain Iris Way, West Jordan, UT 84081 and is currently estimated at $699,034, approximately $222 per square foot. 9066 S Mountain Iris Way is a home located in Salt Lake County with nearby schools including Copper Canyon School, West Hills Middle School, and Copper Hills High School.
Ownership History
Date
Name
Owned For
Owner Type
Purchase Details
Closed on
Jul 20, 2016
Sold by
Janssen Aaron D and Janssen Celeste H
Bought by
Yorgason Andrew and Yorgason Melissa
Current Estimated Value
Home Financials for this Owner
Home Financials are based on the most recent Mortgage that was taken out on this home.
Original Mortgage
$271,500
Outstanding Balance
$216,599
Interest Rate
3.56%
Mortgage Type
New Conventional
Estimated Equity
$482,435
Purchase Details
Closed on
Jun 30, 2003
Sold by
Hj Builders Inc
Bought by
Janssen Aaron D and Janssen Celeste H
Home Financials for this Owner
Home Financials are based on the most recent Mortgage that was taken out on this home.
Original Mortgage
$200,930
Interest Rate
5.18%
Mortgage Type
Seller Take Back
Purchase Details
Closed on
Jul 22, 2002
Sold by
Kfp Corp
Bought by
Hj Builders Inc
Create a Home Valuation Report for This Property
The Home Valuation Report is an in-depth analysis detailing your home's value as well as a comparison with similar homes in the area
Home Values in the Area
Average Home Value in this Area
Purchase History
| Date | Buyer | Sale Price | Title Company |
|---|---|---|---|
| Yorgason Andrew | -- | Magellan Title | |
| Janssen Aaron D | -- | Merrill Title | |
| Hj Builders Inc | -- | Meridian Title |
Source: Public Records
Mortgage History
| Date | Status | Borrower | Loan Amount |
|---|---|---|---|
| Open | Yorgason Andrew | $271,500 | |
| Previous Owner | Janssen Aaron D | $200,930 |
Source: Public Records
Tax History Compared to Growth
Tax History
| Year | Tax Paid | Tax Assessment Tax Assessment Total Assessment is a certain percentage of the fair market value that is determined by local assessors to be the total taxable value of land and additions on the property. | Land | Improvement |
|---|---|---|---|---|
| 2025 | $3,383 | $668,200 | $170,000 | $498,200 |
| 2024 | $3,383 | $650,900 | $165,200 | $485,700 |
| 2023 | $3,434 | $622,700 | $158,900 | $463,800 |
| 2022 | $3,465 | $618,100 | $155,800 | $462,300 |
| 2021 | $2,947 | $478,500 | $121,600 | $356,900 |
| 2020 | $2,864 | $436,500 | $121,600 | $314,900 |
| 2019 | $2,808 | $419,600 | $121,600 | $298,000 |
| 2018 | $2,684 | $397,800 | $118,300 | $279,500 |
| 2017 | $2,468 | $364,200 | $118,300 | $245,900 |
| 2016 | $2,379 | $329,900 | $118,300 | $211,600 |
| 2015 | $2,340 | $316,400 | $120,500 | $195,900 |
| 2014 | $2,355 | $313,400 | $120,500 | $192,900 |
Source: Public Records
Map
Nearby Homes
- 9118 S Wisteria Way
- 5098 Cherry Laurel Ln
- 8854 Rocky Creek Dr
- 8793 S Big Bar Ct
- 9332 S Wild Clover Ln
- 4904 Wild Acres Dr
- 5582 Washoe Cove
- 8577 Autumn Gold Cir
- 4887 W 8620 S
- 4707 W Granada Hills Ct
- 8453 S Windmill Dr
- 8441 S Spratling Dr
- 4624 Pine Crossing Dr
- 8322 Copper Vista Cir
- 4565 Lennox Dr
- 7903 Mckenzie Ln
- 7886 Mckenzie Ln
- 9353 S 4460 W
- 7214 S Sage Run Rd
- 5746 W Swift Creek Rd
- 9066 Mountain Iris Way
- 9078 S Mountain Iris Way
- 9078 Mountain Iris Way
- 9054 S Mountain Iris Way
- 9054 Mountain Iris Way
- 9079 Wisteria Way
- 9067 Wisteria Way
- 9091 S Wisteria Way
- 9091 Wisteria Way
- 9063 S Mnt Iris Way
- 9063 S Mtn Iris Way
- 9063 Mountain Iris Way
- 9092 Mountain Iris Way
- 9042 Mountain Iris Way
- 9075 Mountain Iris Way
- 9075 S Mountain Iris Way
- 9047 S Mountain Iris Way
- 9047 Mountain Iris Way
- 9103 Wisteria Way
- 9053 S Wisteria Way