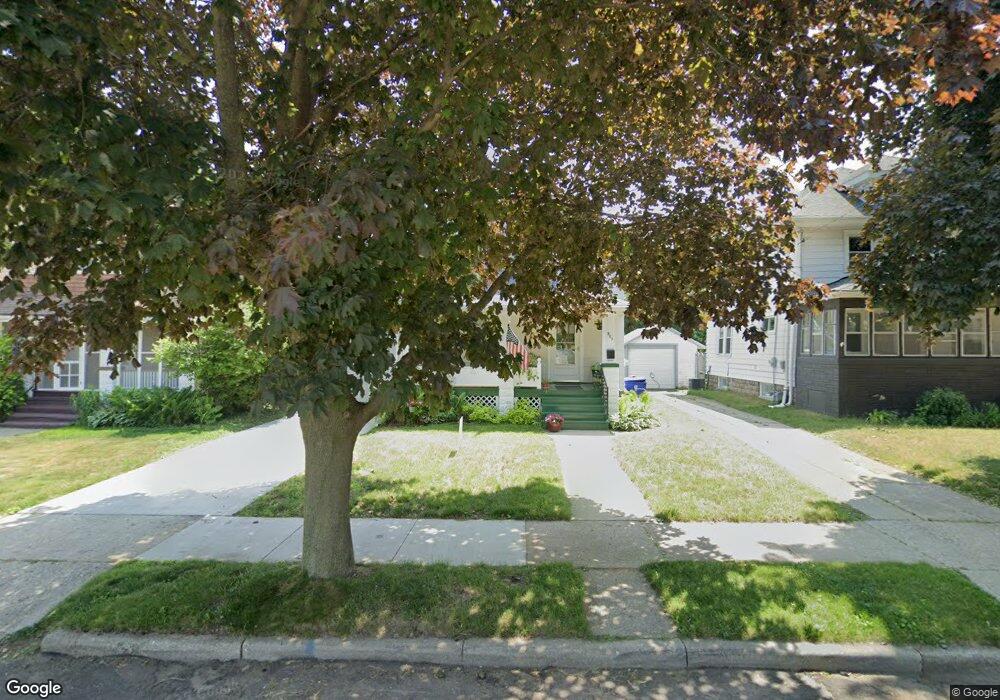
907 71st St Kenosha, WI 53143
Allendale NeighborhoodEstimated Value: $210,021 - $231,000
3
Beds
1
Bath
1,248
Sq Ft
$180/Sq Ft
Est. Value
About This Home
This home is located at 907 71st St, Kenosha, WI 53143 and is currently estimated at $224,505, approximately $179 per square foot. 907 71st St is a home located in Kenosha County with nearby schools including Southport Elementary School, Lincoln Middle School, and Tremper High School.
Ownership History
Date
Name
Owned For
Owner Type
Purchase Details
Closed on
May 8, 2020
Sold by
Kaiser Karen T
Bought by
Kaiser Kenneth J
Current Estimated Value
Purchase Details
Closed on
Nov 17, 2017
Sold by
Aker Carmella J
Bought by
Kaiser Karen T
Home Financials for this Owner
Home Financials are based on the most recent Mortgage that was taken out on this home.
Original Mortgage
$122,637
Outstanding Balance
$102,845
Interest Rate
3.88%
Mortgage Type
FHA
Estimated Equity
$121,660
Create a Home Valuation Report for This Property
The Home Valuation Report is an in-depth analysis detailing your home's value as well as a comparison with similar homes in the area
Home Values in the Area
Average Home Value in this Area
Purchase History
| Date | Buyer | Sale Price | Title Company |
|---|---|---|---|
| Kaiser Kenneth J | -- | None Available | |
| Kaiser Karen T | $124,900 | -- |
Source: Public Records
Mortgage History
| Date | Status | Borrower | Loan Amount |
|---|---|---|---|
| Open | Kaiser Karen T | $122,637 |
Source: Public Records
Tax History Compared to Growth
Tax History
| Year | Tax Paid | Tax Assessment Tax Assessment Total Assessment is a certain percentage of the fair market value that is determined by local assessors to be the total taxable value of land and additions on the property. | Land | Improvement |
|---|---|---|---|---|
| 2024 | $2,402 | $106,200 | $16,400 | $89,800 |
| 2023 | $2,402 | $106,200 | $16,400 | $89,800 |
| 2022 | $2,440 | $106,200 | $16,400 | $89,800 |
| 2021 | $2,495 | $106,200 | $16,400 | $89,800 |
| 2020 | $2,596 | $106,200 | $16,400 | $89,800 |
| 2019 | $2,489 | $106,200 | $16,400 | $89,800 |
| 2018 | $2,449 | $82,100 | $16,400 | $65,700 |
| 2017 | $2,075 | $82,100 | $16,400 | $65,700 |
| 2016 | $2,024 | $82,100 | $16,400 | $65,700 |
| 2015 | $1,870 | $73,200 | $18,400 | $54,800 |
| 2014 | $1,850 | $73,200 | $18,400 | $54,800 |
Source: Public Records
Map
Nearby Homes