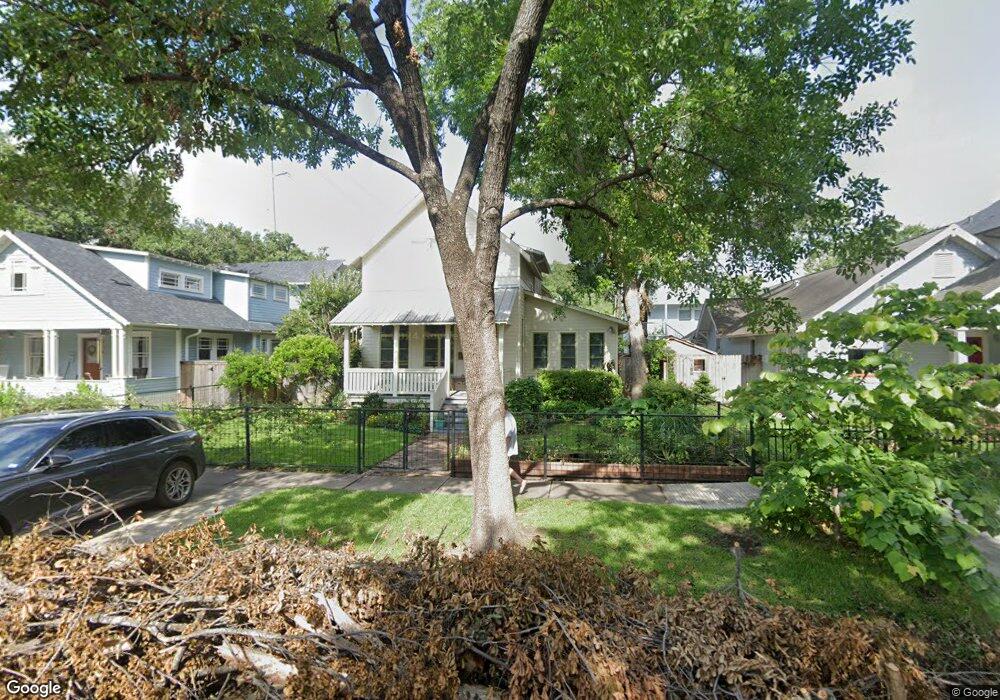
907 Allston St Houston, TX 77008
Greater Heights NeighborhoodEstimated Value: $1,213,000 - $1,329,000
3
Beds
3
Baths
2,872
Sq Ft
$438/Sq Ft
Est. Value
About This Home
This home is located at 907 Allston St, Houston, TX 77008 and is currently estimated at $1,259,176, approximately $438 per square foot. 907 Allston St is a home located in Harris County with nearby schools including Harvard Elementary School, Hogg Middle, and Heights High School.
Ownership History
Date
Name
Owned For
Owner Type
Purchase Details
Closed on
Jul 13, 2022
Sold by
Nancy Pittman
Bought by
Pittman Nancy
Current Estimated Value
Purchase Details
Closed on
Dec 29, 2016
Sold by
Maler Michael O and Poyser Linda A
Bought by
Weinheimer Steven P and Jenkins Lynn B
Purchase Details
Closed on
Jul 31, 2007
Sold by
Miller Preston and Miller Kristin
Bought by
Maler Michael O and Poyser Linda A
Home Financials for this Owner
Home Financials are based on the most recent Mortgage that was taken out on this home.
Original Mortgage
$200,000
Interest Rate
6.73%
Mortgage Type
Purchase Money Mortgage
Purchase Details
Closed on
Oct 22, 2004
Sold by
Eagle Heritage Enterprises Ltd
Bought by
Miller Preston and Miller Kristin
Home Financials for this Owner
Home Financials are based on the most recent Mortgage that was taken out on this home.
Original Mortgage
$505,991
Interest Rate
5.73%
Mortgage Type
Construction
Create a Home Valuation Report for This Property
The Home Valuation Report is an in-depth analysis detailing your home's value as well as a comparison with similar homes in the area
Home Values in the Area
Average Home Value in this Area
Purchase History
| Date | Buyer | Sale Price | Title Company |
|---|---|---|---|
| Pittman Nancy | -- | None Listed On Document | |
| Weinheimer Steven P | -- | Stewart Title | |
| Maler Michael O | -- | Etc | |
| Miller Preston | -- | -- |
Source: Public Records
Mortgage History
| Date | Status | Borrower | Loan Amount |
|---|---|---|---|
| Previous Owner | Maler Michael O | $200,000 | |
| Previous Owner | Miller Preston | $505,991 |
Source: Public Records
Tax History Compared to Growth
Tax History
| Year | Tax Paid | Tax Assessment Tax Assessment Total Assessment is a certain percentage of the fair market value that is determined by local assessors to be the total taxable value of land and additions on the property. | Land | Improvement |
|---|---|---|---|---|
| 2025 | $14,498 | $1,329,023 | $932,500 | $396,523 |
| 2024 | $14,498 | $1,317,453 | $932,500 | $384,953 |
| 2023 | $14,498 | $1,280,449 | $932,500 | $347,949 |
| 2022 | $22,128 | $1,004,960 | $699,375 | $305,585 |
| 2021 | $23,635 | $1,014,089 | $671,400 | $342,689 |
| 2020 | $24,775 | $1,023,106 | $671,400 | $351,706 |
| 2019 | $24,410 | $992,746 | $606,125 | $386,621 |
| 2018 | $17,539 | $876,960 | $559,500 | $317,460 |
| 2017 | $22,174 | $876,960 | $559,500 | $317,460 |
| 2016 | $19,122 | $774,727 | $477,750 | $296,977 |
| 2015 | $12,741 | $693,152 | $398,125 | $295,027 |
| 2014 | $12,741 | $721,920 | $358,313 | $363,607 |
Source: Public Records
Map
Nearby Homes
- 836 Allston St
- 953 Yale St Unit 1
- 811 Yale St
- 809 Heights Blvd
- 805 Heights Blvd
- 912 Heights Blvd
- 319 W 10th St
- 224 W 8th St
- 826 Heights Blvd
- 1007 Heights Blvd
- 913 Tulane St
- 1026 Allston St
- 513 W 8th St
- 919 Ashland St Unit B
- 844 Cortlandt St
- 802 Waverly St Unit D
- 1109 Rutland St
- 806 Waverly St
- 220 E 8th St
- 921 Arlington St