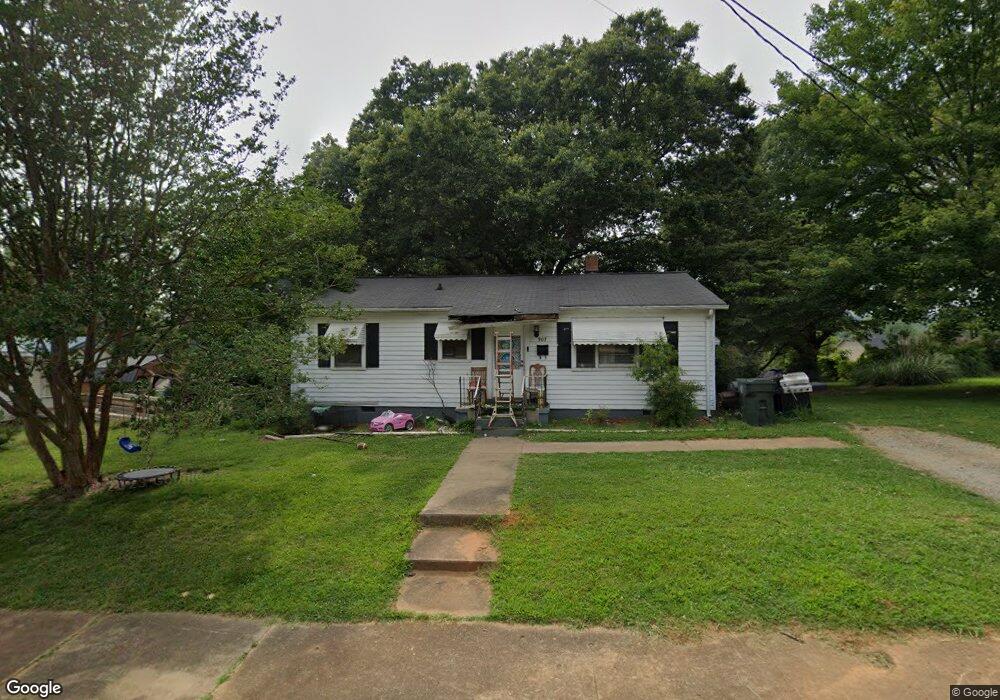
907 Church St Kings Mountain, NC 28086
Estimated Value: $137,000 - $210,000
3
Beds
1
Bath
912
Sq Ft
$186/Sq Ft
Est. Value
About This Home
This home is located at 907 Church St, Kings Mountain, NC 28086 and is currently estimated at $169,928, approximately $186 per square foot. 907 Church St is a home located in Cleveland County with nearby schools including East Elementary School, Kings Mountain Middle, and Kings Mountain Intermediate School.
Ownership History
Date
Name
Owned For
Owner Type
Purchase Details
Closed on
Dec 5, 2023
Sold by
Deaton Monty Durand and Deaton Amanda Blanton
Bought by
Lets Go Properties Llc
Current Estimated Value
Purchase Details
Closed on
Aug 5, 2005
Sold by
Henderson Stephen Lee and Henderson Mary A
Bought by
Deaton Monty D and Deaton Amanda B
Home Financials for this Owner
Home Financials are based on the most recent Mortgage that was taken out on this home.
Original Mortgage
$44,000
Interest Rate
5.51%
Mortgage Type
Purchase Money Mortgage
Create a Home Valuation Report for This Property
The Home Valuation Report is an in-depth analysis detailing your home's value as well as a comparison with similar homes in the area
Home Values in the Area
Average Home Value in this Area
Purchase History
| Date | Buyer | Sale Price | Title Company |
|---|---|---|---|
| Lets Go Properties Llc | -- | None Listed On Document | |
| Deaton Monty D | $46,000 | None Available |
Source: Public Records
Mortgage History
| Date | Status | Borrower | Loan Amount |
|---|---|---|---|
| Previous Owner | Deaton Monty D | $44,000 |
Source: Public Records
Tax History Compared to Growth
Tax History
| Year | Tax Paid | Tax Assessment Tax Assessment Total Assessment is a certain percentage of the fair market value that is determined by local assessors to be the total taxable value of land and additions on the property. | Land | Improvement |
|---|---|---|---|---|
| 2025 | $676 | $65,906 | $19,312 | $46,594 |
| 2024 | $566 | $46,342 | $9,270 | $37,072 |
| 2023 | $563 | $46,342 | $9,270 | $37,072 |
| 2022 | $540 | $46,342 | $9,270 | $37,072 |
| 2021 | $543 | $46,342 | $9,270 | $37,072 |
| 2020 | $496 | $41,172 | $8,806 | $32,366 |
| 2019 | $496 | $41,172 | $8,806 | $32,366 |
| 2018 | $494 | $41,172 | $8,806 | $32,366 |
| 2017 | $492 | $41,172 | $8,806 | $32,366 |
| 2016 | $492 | $41,172 | $8,806 | $32,366 |
| 2015 | $497 | $42,703 | $7,647 | $35,056 |
| 2014 | $497 | $42,703 | $7,647 | $35,056 |
Source: Public Records
Map
Nearby Homes