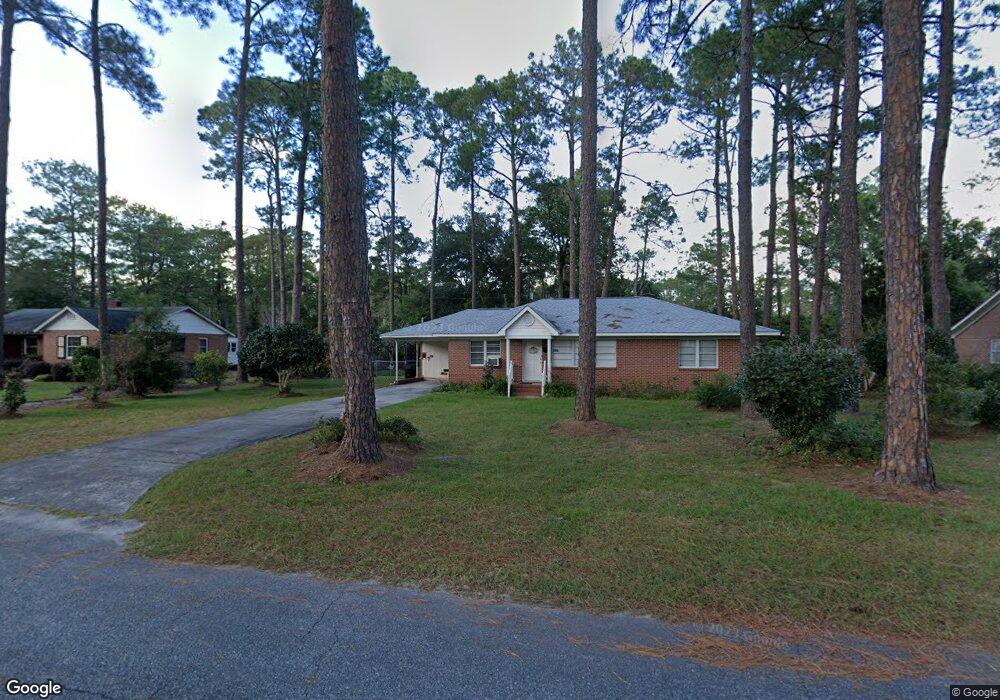
907 Coral Rd Waycross, GA 31501
Estimated Value: $143,190 - $187,000
2
Beds
2
Baths
1,392
Sq Ft
$118/Sq Ft
Est. Value
About This Home
This home is located at 907 Coral Rd, Waycross, GA 31501 and is currently estimated at $164,548, approximately $118 per square foot. 907 Coral Rd is a home located in Ware County with nearby schools including Center Elementary School, Waycross Middle School, and Ware County High School.
Ownership History
Date
Name
Owned For
Owner Type
Purchase Details
Closed on
Sep 25, 2024
Sold by
Steedley Colby
Bought by
Davis Jena Elizabeth and Steedley Colby Lane
Current Estimated Value
Purchase Details
Closed on
Mar 19, 2021
Sold by
Hamid Kendrick Estate
Bought by
Dukes Denise E
Home Financials for this Owner
Home Financials are based on the most recent Mortgage that was taken out on this home.
Original Mortgage
$70,000
Interest Rate
2.8%
Mortgage Type
New Conventional
Purchase Details
Closed on
Jun 28, 2005
Sold by
Johnson James Craig
Bought by
Hamid Kendrick
Home Financials for this Owner
Home Financials are based on the most recent Mortgage that was taken out on this home.
Original Mortgage
$76,226
Interest Rate
5.54%
Mortgage Type
FHA
Purchase Details
Closed on
Jun 20, 2003
Sold by
Wooten Gina A
Bought by
Johnson James Craig
Purchase Details
Closed on
Dec 29, 2000
Sold by
Alday Joe D
Bought by
Wooten Gina A
Create a Home Valuation Report for This Property
The Home Valuation Report is an in-depth analysis detailing your home's value as well as a comparison with similar homes in the area
Home Values in the Area
Average Home Value in this Area
Purchase History
| Date | Buyer | Sale Price | Title Company |
|---|---|---|---|
| Davis Jena Elizabeth | -- | -- | |
| Dukes Denise E | $87,500 | -- | |
| Hamid Kendrick | $79,000 | -- | |
| Johnson James Craig | $100,000 | -- | |
| Wooten Gina A | -- | -- |
Source: Public Records
Mortgage History
| Date | Status | Borrower | Loan Amount |
|---|---|---|---|
| Previous Owner | Dukes Denise E | $70,000 | |
| Previous Owner | Hamid Kendrick | $76,226 |
Source: Public Records
Tax History Compared to Growth
Tax History
| Year | Tax Paid | Tax Assessment Tax Assessment Total Assessment is a certain percentage of the fair market value that is determined by local assessors to be the total taxable value of land and additions on the property. | Land | Improvement |
|---|---|---|---|---|
| 2024 | $1,489 | $56,850 | $7,560 | $49,290 |
| 2023 | $1,960 | $45,153 | $4,392 | $40,761 |
| 2022 | $1,395 | $35,000 | $4,372 | $30,628 |
| 2021 | $1,520 | $35,161 | $4,392 | $30,769 |
| 2020 | $1,492 | $34,229 | $4,392 | $29,837 |
| 2019 | $1,225 | $27,702 | $4,392 | $23,310 |
| 2018 | $1,195 | $26,770 | $4,392 | $22,378 |
| 2017 | $1,167 | $26,770 | $4,392 | $22,378 |
| 2016 | $1,167 | $26,770 | $4,392 | $22,378 |
| 2015 | $1,175 | $26,769 | $4,392 | $22,378 |
| 2014 | $1,174 | $26,770 | $4,392 | $22,378 |
| 2013 | -- | $26,769 | $4,392 | $22,377 |
Source: Public Records
Map
Nearby Homes
- 1001 Coral Rd
- 907 Euclid Ave
- 1500 Saint Marys Dr
- 1009 Euclid Ave
- 0 Saint Marys Dr Unit (TRACT 2 0.25 ACRES)
- 707 Euclid Ave
- 1100 Euclid Ave
- 706 Cherokee Cir
- 1002 Cherokee Cir
- 1205 Dean Dr
- 1002 Baltimore Ave
- 1011 Cherokee Cir
- 903 Atlantic Ave
- 1701 Satilla Blvd
- 00 Seminole Trail
- Lot 3 City Blvd
- 1103 Kontz Ave
- 1715 City Blvd
- 1100 Atlantic Ave
- 713 Magnolia Dr
- 911 Coral Rd
- 901 Coral Rd
- 1506 Suwanne Dr
- 1508 Suwanne Dr
- 1507 Tupelo Dr
- 1508 Suwanne Dr
- 906 Coral Rd
- 900 Coral Rd
- 910 Coral Rd
- 809 Coral Rd
- 1510 Suwanne Dr
- 0 Coral Rd Unit 7483760
- 0 Coral Rd Unit 7483728
- 0 Coral Rd Unit 7493450
- 0 Coral Rd Unit 7488034
- 0 Tupelo Dr Unit 8938419
- 1405 Tupelo Dr
- 810 Coral Rd
- 908 Seminole Trail
- 1508 Tupelo Dr