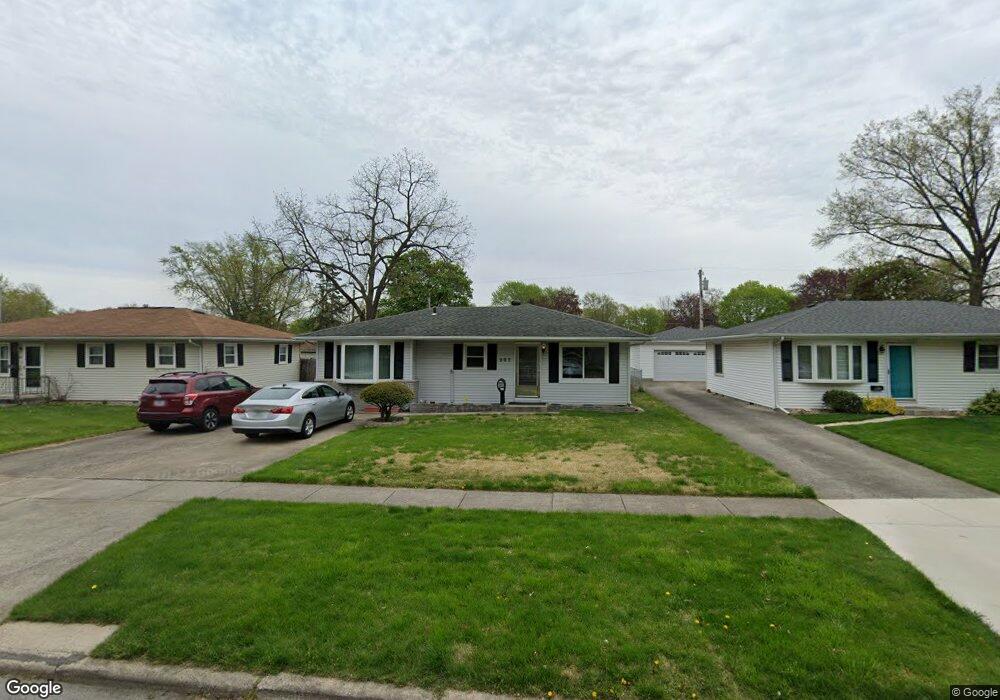
907 Lake St Hobart, IN 46342
Estimated Value: $196,000 - $219,889
3
Beds
2
Baths
1,392
Sq Ft
$150/Sq Ft
Est. Value
About This Home
This home is located at 907 Lake St, Hobart, IN 46342 and is currently estimated at $208,972, approximately $150 per square foot. 907 Lake St is a home located in Lake County with nearby schools including Hobart High School, Trinity Lutheran School, and Hobart Baptist School.
Ownership History
Date
Name
Owned For
Owner Type
Purchase Details
Closed on
Sep 20, 2024
Sold by
Wilkoz Diane
Bought by
Fay Michael Alan and Conn Rachel Renee
Current Estimated Value
Home Financials for this Owner
Home Financials are based on the most recent Mortgage that was taken out on this home.
Original Mortgage
$187,540
Interest Rate
6.49%
Mortgage Type
FHA
Purchase Details
Closed on
Oct 11, 2023
Sold by
Jelaca Dusan
Bought by
Jelaca Dusan and Jelaca Dusan
Create a Home Valuation Report for This Property
The Home Valuation Report is an in-depth analysis detailing your home's value as well as a comparison with similar homes in the area
Home Values in the Area
Average Home Value in this Area
Purchase History
| Date | Buyer | Sale Price | Title Company |
|---|---|---|---|
| Fay Michael Alan | -- | Near North Title Group | |
| Jelaca Dusan | -- | None Listed On Document |
Source: Public Records
Mortgage History
| Date | Status | Borrower | Loan Amount |
|---|---|---|---|
| Previous Owner | Fay Michael Alan | $187,540 |
Source: Public Records
Tax History Compared to Growth
Tax History
| Year | Tax Paid | Tax Assessment Tax Assessment Total Assessment is a certain percentage of the fair market value that is determined by local assessors to be the total taxable value of land and additions on the property. | Land | Improvement |
|---|---|---|---|---|
| 2024 | $7,765 | $196,000 | $35,400 | $160,600 |
| 2023 | $2,269 | $190,200 | $35,400 | $154,800 |
| 2022 | $2,177 | $179,400 | $28,000 | $151,400 |
| 2021 | $1,930 | $158,500 | $21,500 | $137,000 |
| 2020 | $1,914 | $157,900 | $21,500 | $136,400 |
| 2019 | $2,034 | $150,800 | $21,500 | $129,300 |
| 2018 | $2,128 | $147,500 | $21,500 | $126,000 |
| 2017 | $2,144 | $147,100 | $21,500 | $125,600 |
| 2016 | $2,093 | $146,900 | $21,500 | $125,400 |
| 2014 | $2,174 | $151,700 | $21,400 | $130,300 |
| 2013 | $2,235 | $154,400 | $21,400 | $133,000 |
Source: Public Records
Map
Nearby Homes