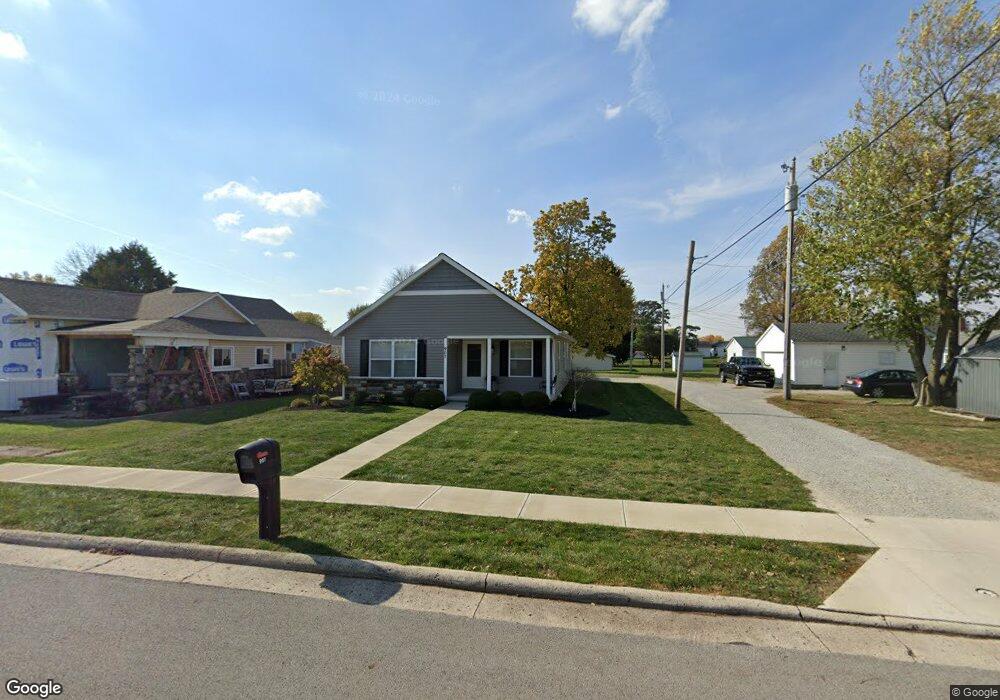
907 Logan St Wapakoneta, OH 45895
Estimated Value: $223,677 - $246,000
3
Beds
2
Baths
1,326
Sq Ft
$174/Sq Ft
Est. Value
About This Home
This home is located at 907 Logan St, Wapakoneta, OH 45895 and is currently estimated at $230,669, approximately $173 per square foot. 907 Logan St is a home located in Auglaize County with nearby schools including Wapakoneta Elementary School, Wapakoneta High School, and Wapakoneta Middle School.
Ownership History
Date
Name
Owned For
Owner Type
Purchase Details
Closed on
May 13, 2020
Sold by
Becker Rental Properties Llc
Bought by
Moser Aaron A and Moser Kodi R
Current Estimated Value
Home Financials for this Owner
Home Financials are based on the most recent Mortgage that was taken out on this home.
Original Mortgage
$132,000
Outstanding Balance
$92,331
Interest Rate
3.3%
Mortgage Type
New Conventional
Estimated Equity
$138,338
Purchase Details
Closed on
Jun 6, 2017
Sold by
The Estate Of Debra J Morgan
Bought by
Becker Rental Properties Llc
Purchase Details
Closed on
Jul 1, 2004
Sold by
Morgan Samuel L
Bought by
Morgan Debra J
Create a Home Valuation Report for This Property
The Home Valuation Report is an in-depth analysis detailing your home's value as well as a comparison with similar homes in the area
Home Values in the Area
Average Home Value in this Area
Purchase History
| Date | Buyer | Sale Price | Title Company |
|---|---|---|---|
| Moser Aaron A | $165,000 | None Available | |
| Becker Rental Properties Llc | $9,000 | None Available | |
| Morgan Debra J | -- | -- |
Source: Public Records
Mortgage History
| Date | Status | Borrower | Loan Amount |
|---|---|---|---|
| Open | Moser Aaron A | $132,000 |
Source: Public Records
Tax History Compared to Growth
Tax History
| Year | Tax Paid | Tax Assessment Tax Assessment Total Assessment is a certain percentage of the fair market value that is determined by local assessors to be the total taxable value of land and additions on the property. | Land | Improvement |
|---|---|---|---|---|
| 2024 | $2,934 | $60,190 | $8,160 | $52,030 |
| 2023 | $2,016 | $60,190 | $8,160 | $52,030 |
| 2022 | $1,725 | $47,670 | $7,480 | $40,190 |
| 2021 | $1,706 | $47,670 | $7,480 | $40,190 |
| 2020 | $1,710 | $47,667 | $7,480 | $40,187 |
| 2019 | $1,465 | $39,211 | $6,153 | $33,058 |
| 2018 | $228 | $6,153 | $6,153 | $0 |
| 2017 | $226 | $6,153 | $6,153 | $0 |
| 2016 | $232 | $5,768 | $5,768 | $0 |
| 2015 | $15,365 | $5,768 | $5,768 | $0 |
| 2014 | $231 | $5,768 | $5,768 | $0 |
| 2013 | $484 | $16,622 | $5,768 | $10,854 |
Source: Public Records
Map
Nearby Homes