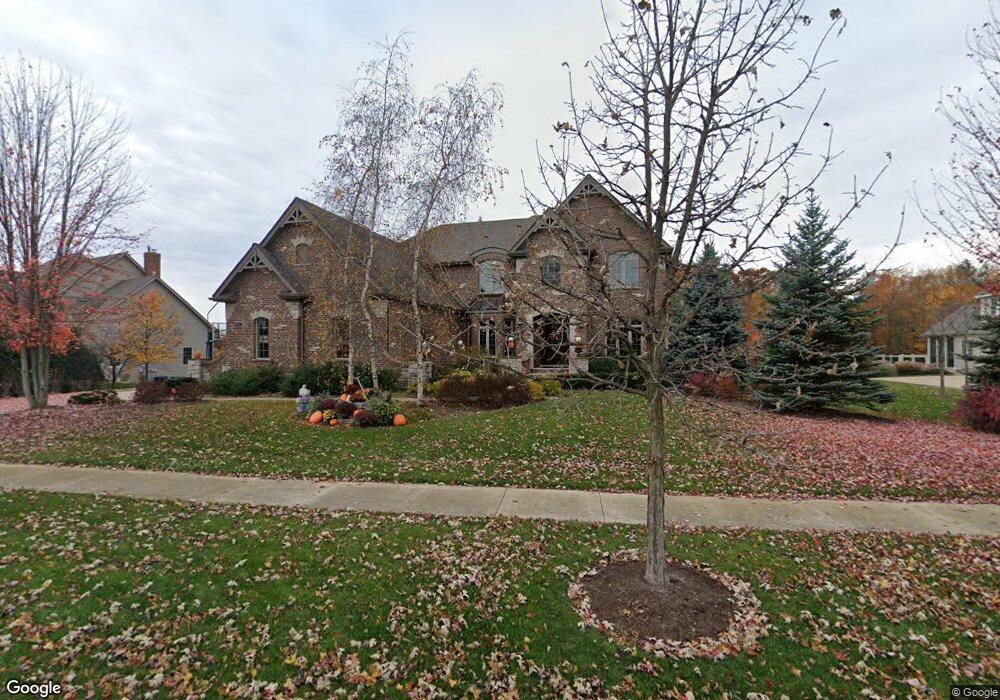
907 Lusted Ln Batavia, IL 60510
Nelson Lake NeighborhoodEstimated Value: $1,052,959 - $1,249,000
5
Beds
--
Bath
4,699
Sq Ft
$240/Sq Ft
Est. Value
About This Home
This home is located at 907 Lusted Ln, Batavia, IL 60510 and is currently estimated at $1,128,990, approximately $240 per square foot. 907 Lusted Ln is a home located in Kane County with nearby schools including Grace McWayne Elementary School, Sam Rotolo Middle School, and Batavia Sr High School.
Ownership History
Date
Name
Owned For
Owner Type
Purchase Details
Closed on
Nov 13, 2009
Sold by
Heinz Roger J and Heinz Janice
Bought by
Heinz Janice L and Heinz Roger J
Current Estimated Value
Purchase Details
Closed on
Oct 3, 2007
Sold by
Kozlowski & Sons Builders Llc
Bought by
Heinz Roger J and Heinz Janice
Home Financials for this Owner
Home Financials are based on the most recent Mortgage that was taken out on this home.
Original Mortgage
$600,000
Outstanding Balance
$375,340
Interest Rate
6.25%
Mortgage Type
Purchase Money Mortgage
Estimated Equity
$753,650
Purchase Details
Closed on
Sep 2, 2005
Sold by
Oliver Hoffmann Corp
Bought by
Kozlowski & Sons Builders Llc
Home Financials for this Owner
Home Financials are based on the most recent Mortgage that was taken out on this home.
Original Mortgage
$192,750
Interest Rate
6.75%
Mortgage Type
Purchase Money Mortgage
Create a Home Valuation Report for This Property
The Home Valuation Report is an in-depth analysis detailing your home's value as well as a comparison with similar homes in the area
Home Values in the Area
Average Home Value in this Area
Purchase History
| Date | Buyer | Sale Price | Title Company |
|---|---|---|---|
| Heinz Janice L | -- | None Available | |
| Heinz Roger J | $961,000 | First American Title | |
| Kozlowski & Sons Builders Llc | $234,000 | Chicago Title Insurance Comp |
Source: Public Records
Mortgage History
| Date | Status | Borrower | Loan Amount |
|---|---|---|---|
| Open | Heinz Roger J | $600,000 | |
| Previous Owner | Kozlowski & Sons Builders Llc | $192,750 |
Source: Public Records
Tax History
| Year | Tax Paid | Tax Assessment Tax Assessment Total Assessment is a certain percentage of the fair market value that is determined by local assessors to be the total taxable value of land and additions on the property. | Land | Improvement |
|---|---|---|---|---|
| 2024 | $25,632 | $332,186 | $59,656 | $272,530 |
| 2023 | $25,184 | $301,494 | $54,144 | $247,350 |
| 2022 | $24,080 | $281,770 | $50,602 | $231,168 |
| 2021 | $23,157 | $267,232 | $47,991 | $219,241 |
| 2020 | $22,601 | $262,094 | $47,068 | $215,026 |
| 2019 | $22,259 | $252,816 | $45,402 | $207,414 |
| 2018 | $22,348 | $253,687 | $43,673 | $210,014 |
| 2017 | $21,834 | $245,322 | $42,233 | $203,089 |
| 2016 | $21,062 | $238,177 | $41,003 | $197,174 |
| 2015 | -- | $232,753 | $40,069 | $192,684 |
| 2014 | -- | $241,655 | $38,808 | $202,847 |
| 2013 | -- | $243,655 | $44,766 | $198,889 |
Source: Public Records
Map
Nearby Homes
- 1S980 Deerpath Rd
- 2441 Bird Ln Unit 1
- 884 Twin Elms Ln
- 116 Furnas Dr
- 113 Furnas Dr
- 218 Weirich Way Unit 88001
- 125 Furnas Dr
- 131 Furnas Dr
- 143 Furnas Dr
- 234 Olmstead Ct
- 2S976 Deerpath Rd
- 1375 Green Pheasant Ln
- 266 Branson Dr
- 1135 Fagan Rd
- 332 Wolcott Ln Unit 62
- 3S177 Deerpath Rd
- 1687 Breton Ave
- 417 Freedlund Course
- 1792 Breton Ave
- 924 Fair Meadow St
- 915 Lusted Ln
- 912 Lusted Ln
- 904 Lusted Ln
- 923 Lusted Ln
- 918 Lusted Ln
- 828 Alberosky Way
- 836 Lusted Ln Unit 3
- 926 Lusted Ln
- 821 Lusted Ln
- 816 Alberosky Way
- 819 Alberosky Way Unit 3
- 824 Lusted Ln
- 932 Lusted Ln
- 809 Lusted Ln
- 804 Alberosky Way
- 812 Lusted Ln Unit 3
- 807 Alberosky Way Unit 3
- 939 Lusted Ln
- 938 Lusted Ln
- 741 Lusted Ln