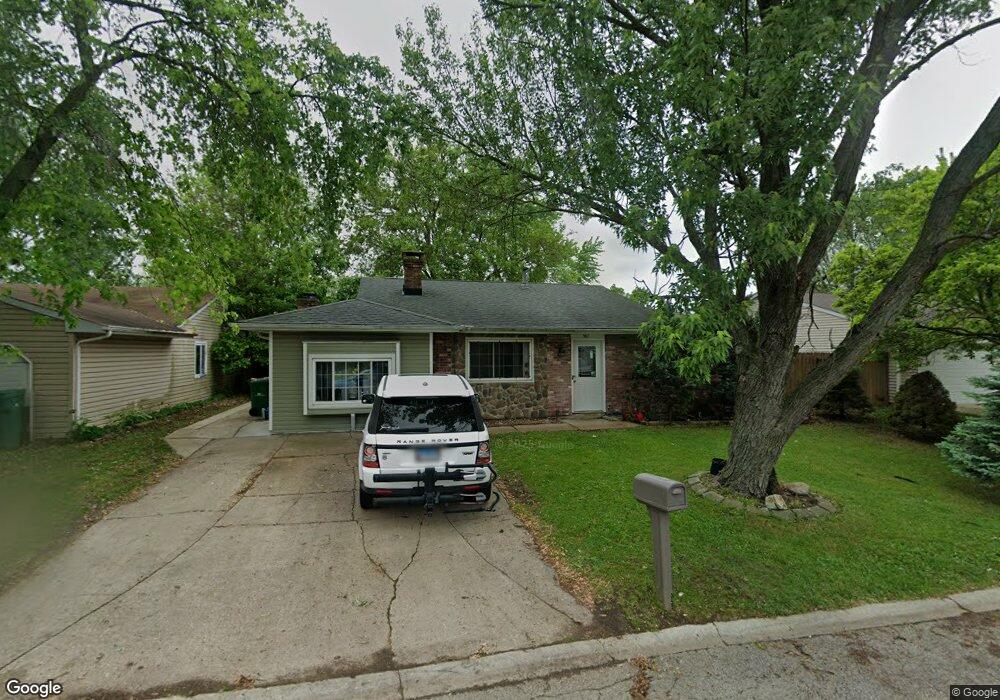
907 Mulford Ln Joliet, IL 60431
Southwest Joliet NeighborhoodEstimated Value: $227,490 - $277,000
--
Bed
--
Bath
1,494
Sq Ft
$167/Sq Ft
Est. Value
About This Home
This home is located at 907 Mulford Ln, Joliet, IL 60431 and is currently estimated at $249,123, approximately $166 per square foot. 907 Mulford Ln is a home located in Will County with nearby schools including Heritage Trail Elementary School, Troy Middle School, and Orenic Intermediate School.
Ownership History
Date
Name
Owned For
Owner Type
Purchase Details
Closed on
Oct 15, 1999
Sold by
Mullin Joseph and Mullin Mary
Bought by
Garcia Ascencion and Garcia Nancy
Current Estimated Value
Home Financials for this Owner
Home Financials are based on the most recent Mortgage that was taken out on this home.
Original Mortgage
$94,223
Outstanding Balance
$28,602
Interest Rate
7.9%
Mortgage Type
FHA
Estimated Equity
$220,521
Purchase Details
Closed on
Jul 27, 1997
Sold by
Mullin Yvonda C and Johnson Yvonda C
Bought by
Mullin Joseph A
Purchase Details
Closed on
Feb 8, 1994
Sold by
Robertson Max I and Robertson Vanessa
Bought by
Mullin Joseph A and Mullin Yvonda C
Home Financials for this Owner
Home Financials are based on the most recent Mortgage that was taken out on this home.
Original Mortgage
$75,900
Interest Rate
7.22%
Create a Home Valuation Report for This Property
The Home Valuation Report is an in-depth analysis detailing your home's value as well as a comparison with similar homes in the area
Home Values in the Area
Average Home Value in this Area
Purchase History
| Date | Buyer | Sale Price | Title Company |
|---|---|---|---|
| Garcia Ascencion | $95,000 | Chicago Title Insurance Co | |
| Mullin Joseph A | -- | -- | |
| Mullin Joseph A | $80,000 | -- |
Source: Public Records
Mortgage History
| Date | Status | Borrower | Loan Amount |
|---|---|---|---|
| Open | Garcia Ascencion | $94,223 | |
| Previous Owner | Mullin Joseph A | $75,900 |
Source: Public Records
Tax History Compared to Growth
Tax History
| Year | Tax Paid | Tax Assessment Tax Assessment Total Assessment is a certain percentage of the fair market value that is determined by local assessors to be the total taxable value of land and additions on the property. | Land | Improvement |
|---|---|---|---|---|
| 2024 | $6,228 | $78,933 | $10,754 | $68,179 |
| 2023 | $6,228 | $70,919 | $9,662 | $61,257 |
| 2022 | $5,477 | $65,013 | $9,143 | $55,870 |
| 2021 | $5,125 | $61,160 | $8,601 | $52,559 |
| 2020 | $4,558 | $54,992 | $8,601 | $46,391 |
| 2019 | $4,413 | $52,750 | $8,250 | $44,500 |
| 2018 | $3,983 | $46,950 | $8,250 | $38,700 |
| 2017 | $3,585 | $42,150 | $8,250 | $33,900 |
| 2016 | $3,471 | $39,750 | $8,250 | $31,500 |
| 2015 | $3,035 | $37,020 | $7,220 | $29,800 |
| 2014 | $3,035 | $34,720 | $7,220 | $27,500 |
| 2013 | $3,035 | $38,618 | $7,220 | $31,398 |
Source: Public Records
Map
Nearby Homes
- 709 Winterberry Dr
- 710 Silver Leaf Ct Unit 1
- 906 Natoma Ct
- 737 Springwood Dr
- 985 Leawood Dr
- 743 Springwood Dr
- 3255 Longford Dr
- 3406 Karen Dr
- 914 Greenleaf Dr
- 1125 Cathy Dr
- 574 Spring Leaf Dr
- 20400 Rock Run Dr
- 2628 Eagle Dr Unit 2628
- 2632 Crescenzo Dr
- 2689 Jodee Dr Unit B
- 2670 Jodee Dr Unit B
- 4321 Timber Ridge Ct
- 4325 Timber Ridge Ct
- 206 Stephen Ln
- 260 Crabapple Dr
- 913 Mulford Ln
- 885 Mulford Ln
- 906 Menlo Ct
- 919 Mulford Ln
- 914 Menlo Ct
- 882 Menlo Ct
- 906 Mulford Ln Unit 1
- 927 Mulford Ln
- 886 Mulford Ln
- 912 Mulford Ln
- 918 Mulford Ln
- 922 Menlo Ct
- 926 Mulford Ln
- 935 Mulford Ln
- 3468 Longford Dr
- 953 Mulford Ln
- 861 Mulford Ln
- 901 Menlo Ct
- 932 Mulford Ln Unit 1
- 911 Menlo Ct