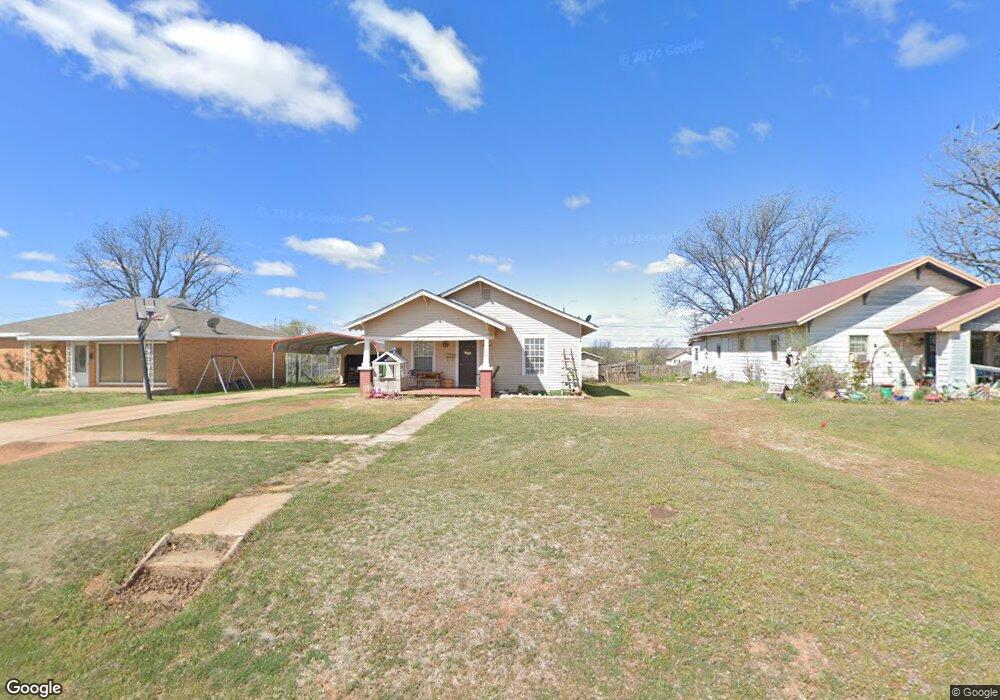
Estimated Value: $56,000 - $94,000
3
Beds
2
Baths
1,424
Sq Ft
$51/Sq Ft
Est. Value
About This Home
This home is located at 907 N 5th St, Sayre, OK 73662 and is currently estimated at $72,700, approximately $51 per square foot. 907 N 5th St is a home located in Beckham County with nearby schools including Sayre Elementary School, Sayre Middle School, and Sayre High School.
Ownership History
Date
Name
Owned For
Owner Type
Purchase Details
Closed on
Dec 20, 2020
Sold by
Kirtley Kenneth Dalton and Kirtley Tiffany
Bought by
Light Angia Lynn
Current Estimated Value
Purchase Details
Closed on
Mar 30, 2011
Sold by
Rodriguez J Rogelio and Gonzales Olga
Bought by
Acosta Asenett and Galaur Juan Carlos
Purchase Details
Closed on
Jun 15, 2007
Sold by
Bowman Jesse and Bowman Spring
Bought by
Rodgriguez Jose Rogelio and Gonzales Olga
Purchase Details
Closed on
Dec 14, 1998
Sold by
Varnell
Bought by
Bowman J
Purchase Details
Closed on
Jul 1, 1993
Sold by
Hall
Bought by
Varnell
Purchase Details
Closed on
Dec 28, 1989
Sold by
Johnson
Bought by
Hall
Create a Home Valuation Report for This Property
The Home Valuation Report is an in-depth analysis detailing your home's value as well as a comparison with similar homes in the area
Home Values in the Area
Average Home Value in this Area
Purchase History
| Date | Buyer | Sale Price | Title Company |
|---|---|---|---|
| Light Angia Lynn | $35,000 | None Available | |
| Acosta Asenett | $20,000 | None Available | |
| Rodgriguez Jose Rogelio | $35,000 | None Available | |
| Bowman J | $21,000 | -- | |
| Varnell | $13,000 | -- | |
| Hall | $7,000 | -- |
Source: Public Records
Tax History Compared to Growth
Tax History
| Year | Tax Paid | Tax Assessment Tax Assessment Total Assessment is a certain percentage of the fair market value that is determined by local assessors to be the total taxable value of land and additions on the property. | Land | Improvement |
|---|---|---|---|---|
| 2025 | $316 | $3,885 | $142 | $3,743 |
| 2024 | $316 | $3,885 | $142 | $3,743 |
| 2023 | $302 | $3,723 | $142 | $3,581 |
| 2022 | $289 | $3,545 | $446 | $3,099 |
| 2021 | $280 | $3,377 | $432 | $2,945 |
| 2020 | $275 | $3,216 | $388 | $2,828 |
| 2019 | $261 | $3,063 | $323 | $2,740 |
| 2018 | $248 | $2,917 | $312 | $2,605 |
| 2017 | $237 | $2,778 | $302 | $2,476 |
| 2016 | $226 | $2,646 | $293 | $2,353 |
| 2015 | $195 | $2,520 | $284 | $2,236 |
| 2014 | $182 | $2,400 | $275 | $2,125 |
Source: Public Records
Map
Nearby Homes