907 N Culberson St Gainesville, TX 76240
Estimated Value: $139,000 - $157,000
2
Beds
1
Bath
784
Sq Ft
$186/Sq Ft
Est. Value
About This Home
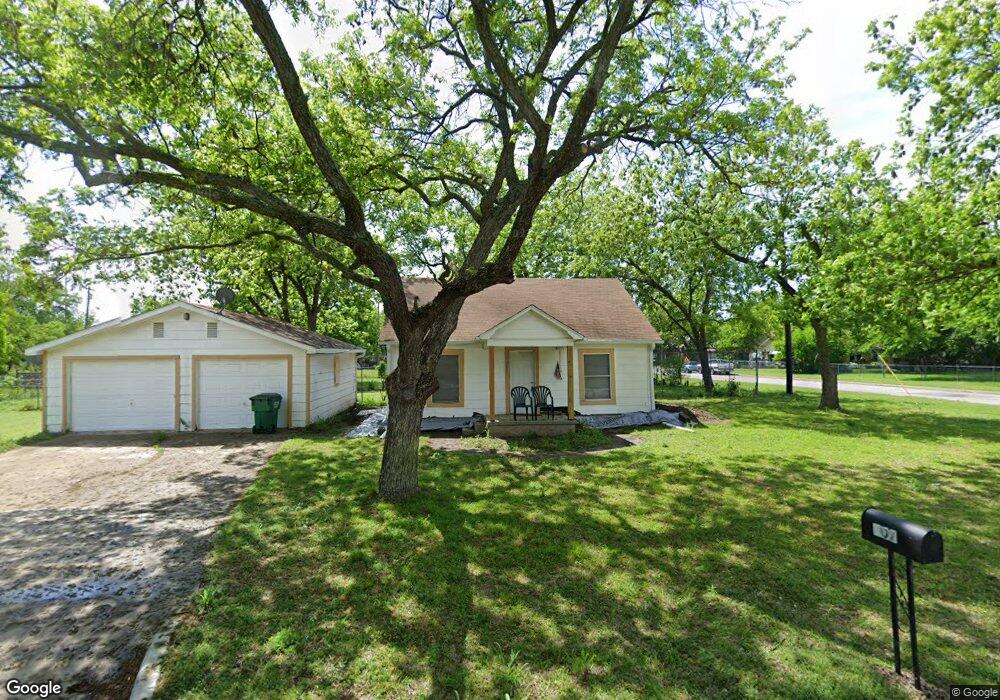
This home is located at 907 N Culberson St, Gainesville, TX 76240 and is currently estimated at $146,142, approximately $186 per square foot. 907 N Culberson St is a home located in Cooke County with nearby schools including Edison Elementary School, W.E. Chalmers Elementary School, and Gainesville Jr. High School.
Ownership History
Date
Name
Owned For
Owner Type
Purchase Details
Closed on
Jan 2, 2025
Sold by
Preston Robert V and Preston Rosemarie
Bought by
R & R Preston Investments Llc
Current Estimated Value
Purchase Details
Closed on
Nov 7, 2022
Sold by
Lotus Property Solutions Llc
Bought by
Preston Robert V and Preston Rosemarie
Purchase Details
Closed on
Nov 4, 2022
Sold by
Ensey Byron R
Bought by
Lotus Property Solutions Llc
Purchase Details
Closed on
Oct 26, 2022
Sold by
Ensey Byron R
Bought by
Briley Chad Allen
Purchase Details
Closed on
May 9, 2017
Sold by
Leach Dortha D and Leach Lloyd D
Bought by
Ensey Brenda J
Purchase Details
Closed on
Mar 20, 2009
Sold by
Leach Dortha D and Leach Lloyd D
Bought by
Fain Brenda J and Ensey Gayna L
Create a Home Valuation Report for This Property
The Home Valuation Report is an in-depth analysis detailing your home's value as well as a comparison with similar homes in the area
Home Values in the Area
Average Home Value in this Area
Purchase History
| Date | Buyer | Sale Price | Title Company |
|---|---|---|---|
| R & R Preston Investments Llc | -- | None Listed On Document | |
| R & R Preston Investments Llc | -- | None Listed On Document | |
| Preston Robert V | -- | -- | |
| Lotus Property Solutions Llc | -- | -- | |
| Ensey Byron R | -- | -- | |
| Briley Chad Allen | $3,000 | -- | |
| Ensey Brenda J | -- | None Available | |
| Fain Brenda J | -- | -- |
Source: Public Records
Tax History Compared to Growth
Tax History
| Year | Tax Paid | Tax Assessment Tax Assessment Total Assessment is a certain percentage of the fair market value that is determined by local assessors to be the total taxable value of land and additions on the property. | Land | Improvement |
|---|---|---|---|---|
| 2025 | $2,394 | $111,064 | $41,757 | $69,307 |
| 2024 | $2,394 | $126,336 | $56,378 | $69,958 |
| 2023 | $2,135 | $108,829 | $47,011 | $61,818 |
| 2022 | $2,266 | $104,084 | $47,925 | $56,159 |
| 2021 | $1,928 | $74,864 | $28,125 | $46,739 |
| 2020 | $1,639 | $61,708 | $21,150 | $40,558 |
| 2019 | $1,233 | $45,102 | $10,575 | $34,527 |
| 2018 | $1,003 | $36,754 | $5,400 | $31,354 |
| 2017 | $959 | $35,269 | $5,400 | $29,869 |
| 2015 | $914 | $34,520 | $5,400 | $29,120 |
| 2014 | $914 | $34,364 | $5,400 | $28,964 |
Source: Public Records
Map
Nearby Homes
- 810 Mill St
- 1213 Mill St
- 1203 Mill St
- 1124 Throckmorton St
- 901 W Star St
- 1214 Witherspoon St
- 620 Throckmorton St
- 1120 N Commerce St
- 818 N Commerce St
- 535 Hancock St
- 527 N Chestnut St
- 312 W Scott St
- 322 W Scott St
- 509 N Chestnut St
- 113 E Cummings St
- 618 Moran St
- 400 N Weaver St
- 1704 Throckmorton St
- TBD E Highway 82
- 000 U S Highway 82
- 614 Potter St
- 901 N Culberson St
- 1001 N Culberson St
- 906 N Culberson St
- 610 Potter St
- 904 N Culberson St
- 719 Potter St
- 701 Hall St
- 613 Potter St
- 713 Hall St
- 915 Mill St
- 605 Potter St Unit 605A
- 605A Potter St
- 915 Hancock St
- 925 Hancock St
- 615 Hall St
- 903 Mill St
- 801 Potter St
- 1001 Hancock St
- 607 Hall St