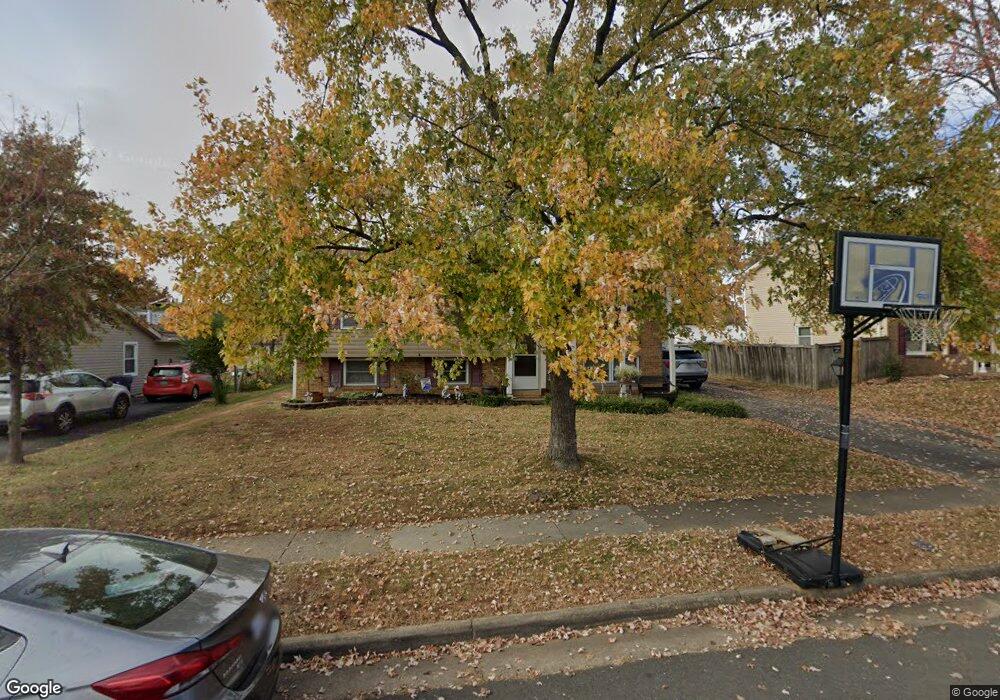
907 N Watford St Sterling, VA 20164
Estimated Value: $548,874 - $631,000
--
Bed
3
Baths
1,084
Sq Ft
$549/Sq Ft
Est. Value
About This Home
This home is located at 907 N Watford St, Sterling, VA 20164 and is currently estimated at $595,219, approximately $549 per square foot. 907 N Watford St is a home located in Loudoun County with nearby schools including Sterling Elementary School, Sterling Middle School, and Park View High School.
Ownership History
Date
Name
Owned For
Owner Type
Purchase Details
Closed on
May 31, 1994
Sold by
Dl Dickens
Bought by
Grant James M
Current Estimated Value
Home Financials for this Owner
Home Financials are based on the most recent Mortgage that was taken out on this home.
Original Mortgage
$149,700
Interest Rate
8.22%
Create a Home Valuation Report for This Property
The Home Valuation Report is an in-depth analysis detailing your home's value as well as a comparison with similar homes in the area
Home Values in the Area
Average Home Value in this Area
Purchase History
| Date | Buyer | Sale Price | Title Company |
|---|---|---|---|
| Grant James M | $151,750 | -- |
Source: Public Records
Mortgage History
| Date | Status | Borrower | Loan Amount |
|---|---|---|---|
| Closed | Grant James M | $149,700 |
Source: Public Records
Tax History Compared to Growth
Tax History
| Year | Tax Paid | Tax Assessment Tax Assessment Total Assessment is a certain percentage of the fair market value that is determined by local assessors to be the total taxable value of land and additions on the property. | Land | Improvement |
|---|---|---|---|---|
| 2025 | $4,729 | $587,460 | $233,800 | $353,660 |
| 2024 | $4,638 | $536,200 | $208,800 | $327,400 |
| 2023 | $4,383 | $500,930 | $208,800 | $292,130 |
| 2022 | $4,215 | $473,560 | $188,800 | $284,760 |
| 2021 | $4,188 | $427,360 | $178,800 | $248,560 |
| 2020 | $4,159 | $401,880 | $153,800 | $248,080 |
| 2019 | $4,082 | $390,610 | $153,800 | $236,810 |
| 2018 | $3,853 | $355,140 | $138,800 | $216,340 |
| 2017 | $3,797 | $337,470 | $138,800 | $198,670 |
| 2016 | $3,752 | $327,650 | $0 | $0 |
| 2015 | $3,375 | $177,090 | $0 | $177,090 |
| 2014 | $3,323 | $167,440 | $0 | $167,440 |
Source: Public Records
Map
Nearby Homes
- 805 N York Rd
- 1005 N Sterling Blvd
- 724 N Amelia St
- 21914 Hawksbill High Cir Unit 304
- 21899 Hawksbill High Cir
- 605 N York Rd
- 46440 Beartown Dr
- 814 N Croydon St
- 202 E Gordon St
- 46330 Mount Kellogg Terrace
- 46320 Mount Milstead Terrace Unit 301
- 113 Connemara Dr
- 409 N Argonne Ave
- 208 Keyes Ct
- 224 W Beech Rd
- 210 W Beech Rd
- 301 N Alder Ave
- 46683 Bartlet Square
- 626 W Church Rd
- 111 N Hickory Rd
- 905 N Watford St
- 909 N Watford St
- 904 N York Rd
- 906 N York Rd
- 902 N York Rd
- 903 N Watford St
- 908 N York Rd
- 906 N Watford St
- 321 W Juniper Ave
- 908 N Watford St
- 904 N Watford St
- 900 N York Rd
- 902 N Watford St
- 315 W Juniper Ave
- 910 N York Rd
- 901 N Watford St
- 808 N York Rd
- 900 N Watford St
- 907 N Vernon St
- 909 N Vernon St