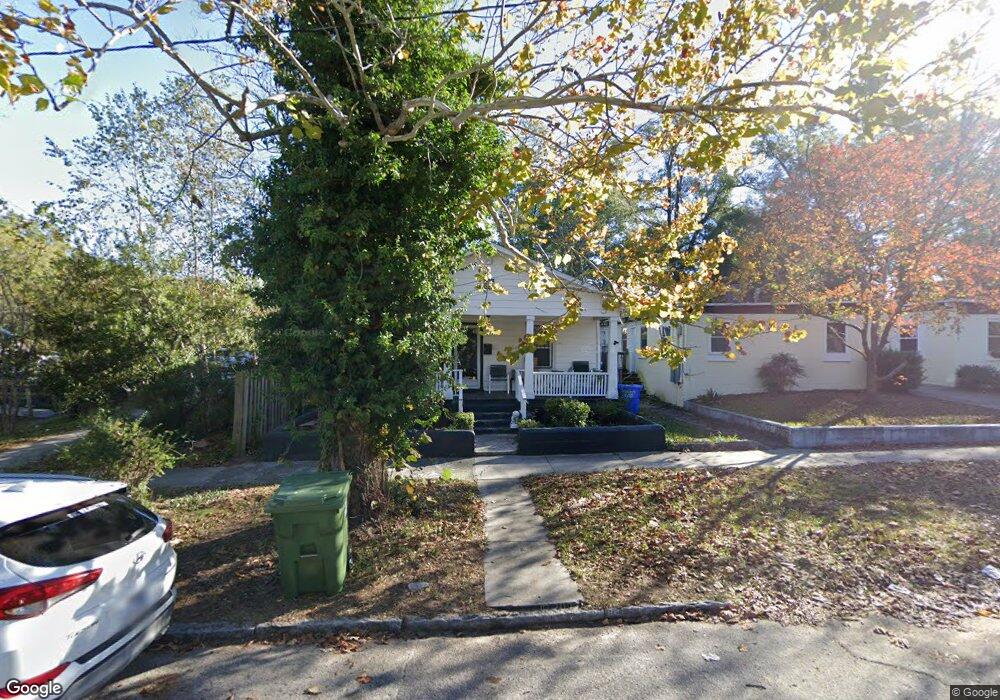
907 S 4th St Wilmington, NC 28401
Dry Pond-South Side NeighborhoodEstimated Value: $216,669 - $400,000
3
Beds
1
Bath
1,008
Sq Ft
$291/Sq Ft
Est. Value
About This Home
This home is located at 907 S 4th St, Wilmington, NC 28401 and is currently estimated at $293,417, approximately $291 per square foot. 907 S 4th St is a home located in New Hanover County with nearby schools including Snipes Academy of Arts & Design, Williston Middle School, and New Hanover High School.
Ownership History
Date
Name
Owned For
Owner Type
Purchase Details
Closed on
Sep 28, 2000
Sold by
Portee Patricia
Bought by
Johnson Rebecca
Current Estimated Value
Purchase Details
Closed on
May 25, 1997
Sold by
Dukes Orether Hrs
Bought by
Portee Patricia
Purchase Details
Closed on
Nov 21, 1992
Sold by
Dukes William
Bought by
Dukes Orether
Purchase Details
Closed on
Jan 12, 1977
Sold by
Davis Frank E Ann Lamb
Bought by
Dukes Wm and Dukes Orether
Purchase Details
Closed on
Feb 17, 1976
Sold by
Davis Joseph H
Bought by
Davis Ann Lamb
Create a Home Valuation Report for This Property
The Home Valuation Report is an in-depth analysis detailing your home's value as well as a comparison with similar homes in the area
Home Values in the Area
Average Home Value in this Area
Purchase History
| Date | Buyer | Sale Price | Title Company |
|---|---|---|---|
| Johnson Rebecca | -- | -- | |
| Portee Patricia | -- | -- | |
| Dukes Orether Heirs | -- | -- | |
| Dukes Orether | -- | -- | |
| Dukes Wm | $10,500 | -- | |
| Davis Ann Lamb | -- | -- |
Source: Public Records
Tax History Compared to Growth
Tax History
| Year | Tax Paid | Tax Assessment Tax Assessment Total Assessment is a certain percentage of the fair market value that is determined by local assessors to be the total taxable value of land and additions on the property. | Land | Improvement |
|---|---|---|---|---|
| 2023 | $910 | $104,600 | $39,200 | $65,400 |
| 2022 | $445 | $104,600 | $39,200 | $65,400 |
| 2021 | $448 | $104,600 | $39,200 | $65,400 |
| 2020 | $349 | $66,200 | $28,300 | $37,900 |
| 2019 | $349 | $66,200 | $28,300 | $37,900 |
| 2018 | $349 | $66,200 | $28,300 | $37,900 |
| 2017 | $349 | $66,200 | $28,300 | $37,900 |
| 2016 | $525 | $94,700 | $33,300 | $61,400 |
| 2015 | $501 | $94,700 | $33,300 | $61,400 |
| 2014 | $480 | $94,700 | $33,300 | $61,400 |
Source: Public Records
Map
Nearby Homes