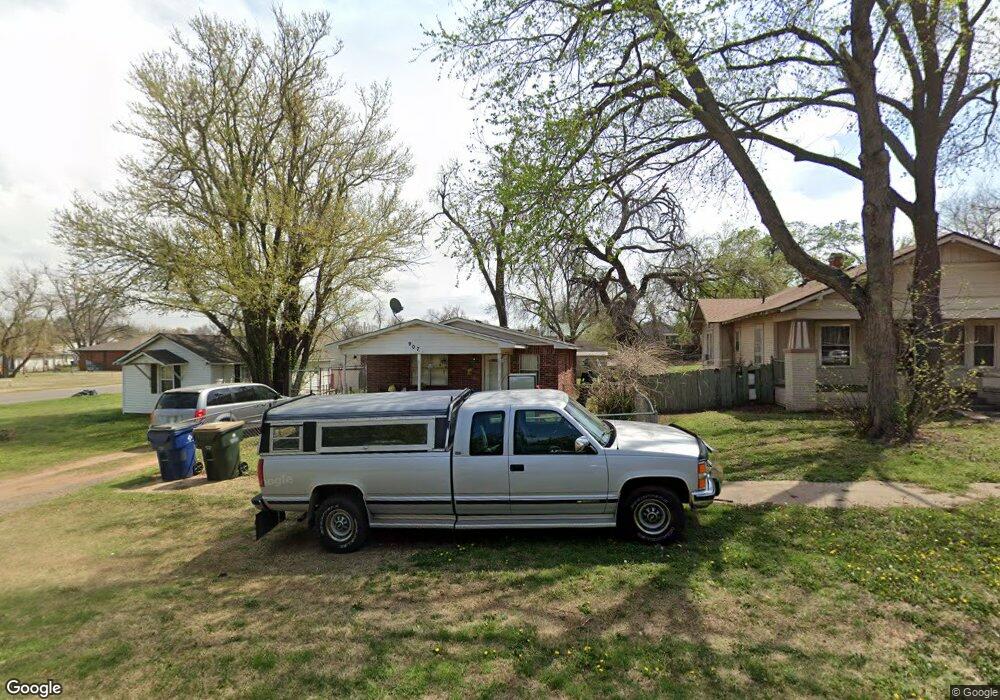
907 W Iowa Ave Chickasha, OK 73018
Estimated Value: $85,000 - $201,116
3
Beds
2
Baths
1,215
Sq Ft
$116/Sq Ft
Est. Value
About This Home
This home is located at 907 W Iowa Ave, Chickasha, OK 73018 and is currently estimated at $140,529, approximately $115 per square foot. 907 W Iowa Ave is a home located in Grady County with nearby schools including Grand Avenue Elementary School, Chickasha Middle School, and Lincoln Elementary School.
Ownership History
Date
Name
Owned For
Owner Type
Purchase Details
Closed on
Aug 27, 2013
Sold by
Smith Carl and Smith Sherrie Lynn
Bought by
Bracher Leslie and Bracher Tammy
Current Estimated Value
Home Financials for this Owner
Home Financials are based on the most recent Mortgage that was taken out on this home.
Original Mortgage
$40,287
Outstanding Balance
$10,285
Interest Rate
4.36%
Mortgage Type
New Conventional
Estimated Equity
$130,244
Purchase Details
Closed on
Feb 15, 2006
Sold by
Centex Home Equity Company Llc
Bought by
Smith Carl and Smith Sherrie Lynn
Home Financials for this Owner
Home Financials are based on the most recent Mortgage that was taken out on this home.
Original Mortgage
$34,200
Interest Rate
6.1%
Mortgage Type
New Conventional
Purchase Details
Closed on
Nov 25, 2002
Sold by
Anthony Linda L Aka
Bought by
Linda L Wilson
Purchase Details
Closed on
Mar 15, 2000
Sold by
Ryans Aubrew W
Bought by
Wilson Linda L
Create a Home Valuation Report for This Property
The Home Valuation Report is an in-depth analysis detailing your home's value as well as a comparison with similar homes in the area
Home Values in the Area
Average Home Value in this Area
Purchase History
| Date | Buyer | Sale Price | Title Company |
|---|---|---|---|
| Bracher Leslie | $39,000 | None Available | |
| Smith Carl | $38,000 | Oklahoma Reo Closing & Title | |
| Linda L Wilson | -- | -- | |
| Wilson Linda L | $12,500 | -- |
Source: Public Records
Mortgage History
| Date | Status | Borrower | Loan Amount |
|---|---|---|---|
| Open | Bracher Leslie | $40,287 | |
| Previous Owner | Smith Carl | $34,200 |
Source: Public Records
Tax History Compared to Growth
Tax History
| Year | Tax Paid | Tax Assessment Tax Assessment Total Assessment is a certain percentage of the fair market value that is determined by local assessors to be the total taxable value of land and additions on the property. | Land | Improvement |
|---|---|---|---|---|
| 2024 | $868 | $9,565 | $894 | $8,671 |
| 2023 | $868 | $9,286 | $1,370 | $7,916 |
| 2022 | $848 | $9,158 | $1,143 | $8,015 |
| 2021 | $844 | $9,393 | $1,143 | $8,250 |
| 2020 | $870 | $9,448 | $1,143 | $8,305 |
| 2019 | $865 | $9,558 | $1,143 | $8,415 |
| 2018 | $908 | $9,819 | $590 | $9,229 |
| 2017 | $919 | $9,876 | $590 | $9,286 |
| 2016 | $926 | $9,867 | $590 | $9,277 |
| 2015 | $992 | $9,579 | $590 | $8,989 |
| 2014 | $992 | $9,469 | $590 | $8,879 |
Source: Public Records
Map
Nearby Homes
- 904 W Minnesota Ave
- 909 W Minnesota Ave
- 1007 W Colorado Ave
- 502 S 7th St
- 1008 W Colorado Ave
- 1027 W Idaho Ave
- 316 S 6th St
- 1016 W Kansas Ave
- 1123 W Kansas Ave
- 302 S 6th St
- 925 W Chickasha Ave
- 827 W Chickasha Ave
- 1310 W Minnesota Ave
- 108 S 9th St
- 1316 W Dakota Ave
- 511 W Minnesota Ave
- 408 S 5th St
- 701 S 6th St
- 828 S 12th St
- 926 S 9th St
- 911 W Iowa Ave
- 901 W Iowa Ave
- 902 W Minnesota Ave
- 912 W Minnesota Ave
- 917 W Iowa Ave
- 914 W Minnesota Ave
- 904 W Minnesota Ave
- 921 W Iowa Ave
- 922 W Minnesota Ave
- 923 W Iowa Ave
- 924 W Minnesota Ave
- 819 W Iowa Ave
- 926 W Minnesota Ave
- 423 S 10th St
- 927 W Iowa Ave
- 908 W Iowa Ave
- 912 W Iowa Ave
- 916 W Iowa Ave
- 928 W Minnesota Ave
- 828 W Iowa Ave