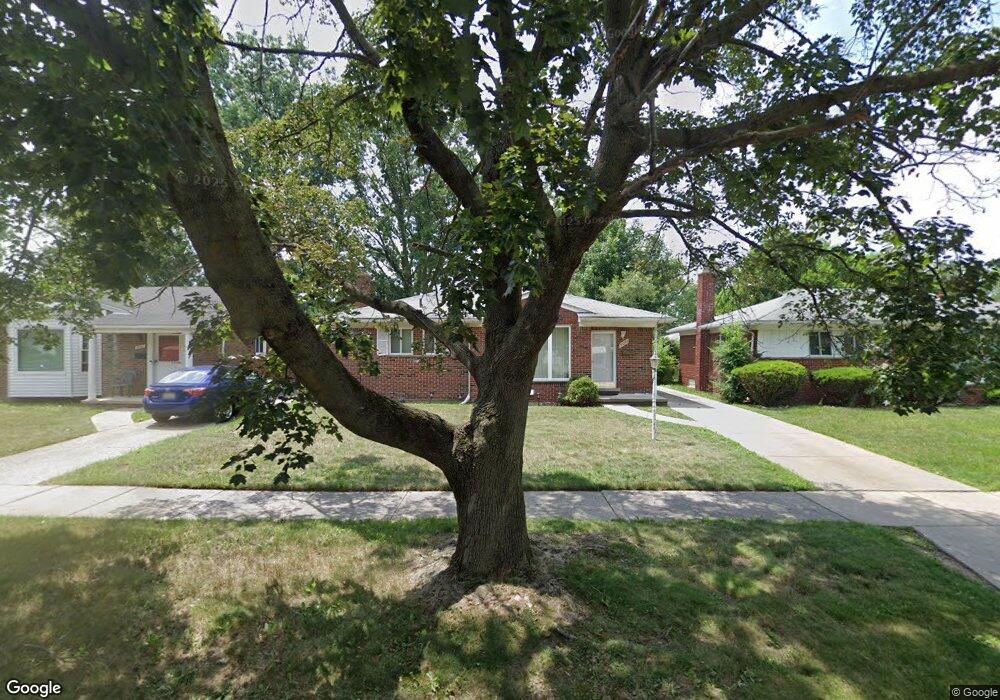
9071 Appleton Redford, MI 48239
Estimated Value: $180,945 - $209,000
3
Beds
2
Baths
1,013
Sq Ft
$194/Sq Ft
Est. Value
About This Home
This home is located at 9071 Appleton, Redford, MI 48239 and is currently estimated at $196,486, approximately $193 per square foot. 9071 Appleton is a home located in Wayne County with nearby schools including John D. Pierce Middle School, Lee M. Thurston High School, and Global Heights Academy.
Ownership History
Date
Name
Owned For
Owner Type
Purchase Details
Closed on
Aug 11, 2017
Sold by
Redford East Llc
Bought by
Michigan Rental Llc
Current Estimated Value
Home Financials for this Owner
Home Financials are based on the most recent Mortgage that was taken out on this home.
Original Mortgage
$1,031,400
Outstanding Balance
$859,227
Interest Rate
3.9%
Mortgage Type
Commercial
Estimated Equity
-$662,741
Purchase Details
Closed on
May 14, 2015
Sold by
Kelly Reco and Residential Credit Solutions I
Bought by
Redford West Llc
Purchase Details
Closed on
Feb 22, 2002
Sold by
Kelly Sandra L
Bought by
Kelly Reco W
Purchase Details
Closed on
May 5, 2000
Sold by
Evelyn Burnett
Bought by
Reco W Kelly
Create a Home Valuation Report for This Property
The Home Valuation Report is an in-depth analysis detailing your home's value as well as a comparison with similar homes in the area
Home Values in the Area
Average Home Value in this Area
Purchase History
| Date | Buyer | Sale Price | Title Company |
|---|---|---|---|
| Michigan Rental Llc | -- | None Available | |
| Redford West Llc | $34,432 | Attorney | |
| Kelly Reco W | -- | -- | |
| Reco W Kelly | $127,000 | -- |
Source: Public Records
Mortgage History
| Date | Status | Borrower | Loan Amount |
|---|---|---|---|
| Open | Michigan Rental Llc | $1,031,400 |
Source: Public Records
Tax History
| Year | Tax Paid | Tax Assessment Tax Assessment Total Assessment is a certain percentage of the fair market value that is determined by local assessors to be the total taxable value of land and additions on the property. | Land | Improvement |
|---|---|---|---|---|
| 2025 | $1,066 | $88,800 | $0 | $0 |
| 2024 | $1,037 | $79,100 | $0 | $0 |
| 2023 | $991 | $68,300 | $0 | $0 |
| 2022 | $2,626 | $58,200 | $0 | $0 |
| 2021 | $3,972 | $55,800 | $0 | $0 |
| 2020 | $3,368 | $50,200 | $0 | $0 |
| 2019 | $2,463 | $38,200 | $0 | $0 |
| 2018 | $884 | $31,600 | $0 | $0 |
| 2017 | $2,683 | $29,100 | $0 | $0 |
| 2016 | $2,195 | $27,100 | $0 | $0 |
| 2015 | $2,530 | $25,300 | $0 | $0 |
| 2013 | $2,630 | $26,800 | $0 | $0 |
| 2012 | $1,762 | $29,600 | $6,900 | $22,700 |
Source: Public Records
Map
Nearby Homes