Estimated Value: $591,000 - $660,000
4
Beds
2
Baths
2,337
Sq Ft
$274/Sq Ft
Est. Value
About This Home
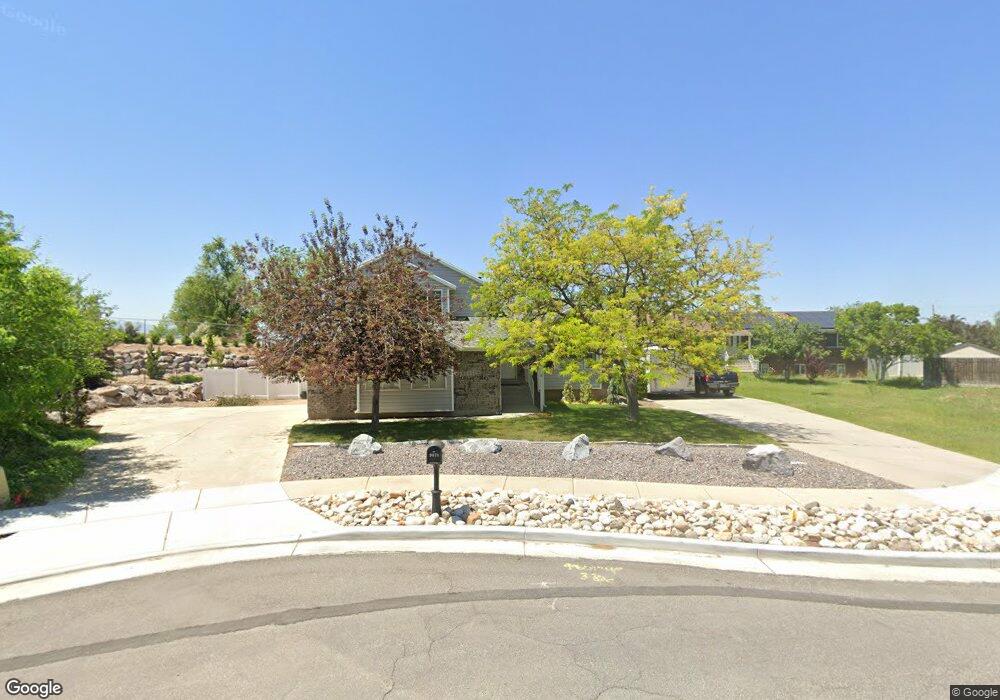
This home is located at 9078 S Hummingbird Cir, Sandy, UT 84094 and is currently estimated at $639,447, approximately $273 per square foot. 9078 S Hummingbird Cir is a home located in Salt Lake County with nearby schools including Silver Mesa Elementary School, Union Middle School, and Hillcrest High School.
Ownership History
Date
Name
Owned For
Owner Type
Purchase Details
Closed on
Mar 22, 2005
Sold by
Palmer R Halroy and Palmer Trudi A
Bought by
Hill Jory T and Hill Rhonda G
Current Estimated Value
Home Financials for this Owner
Home Financials are based on the most recent Mortgage that was taken out on this home.
Original Mortgage
$153,600
Outstanding Balance
$77,458
Interest Rate
5.53%
Mortgage Type
Unknown
Estimated Equity
$561,989
Purchase Details
Closed on
Jul 1, 2002
Sold by
Palmer R Halroy and Palmer Trudi A
Bought by
Palmer R Halroy and Palmer Trudi A
Purchase Details
Closed on
May 16, 1994
Sold by
Trade West Development Corp
Bought by
Palmer Robert Halroy and Palmer Trudi A
Home Financials for this Owner
Home Financials are based on the most recent Mortgage that was taken out on this home.
Original Mortgage
$26,800
Interest Rate
8.1%
Create a Home Valuation Report for This Property
The Home Valuation Report is an in-depth analysis detailing your home's value as well as a comparison with similar homes in the area
Home Values in the Area
Average Home Value in this Area
Purchase History
| Date | Buyer | Sale Price | Title Company |
|---|---|---|---|
| Hill Jory T | -- | First American Title | |
| Palmer R Halroy | -- | -- | |
| Palmer Robert Halroy | -- | First American Title |
Source: Public Records
Mortgage History
| Date | Status | Borrower | Loan Amount |
|---|---|---|---|
| Open | Hill Jory T | $153,600 | |
| Previous Owner | Palmer Robert Halroy | $26,800 |
Source: Public Records
Tax History Compared to Growth
Tax History
| Year | Tax Paid | Tax Assessment Tax Assessment Total Assessment is a certain percentage of the fair market value that is determined by local assessors to be the total taxable value of land and additions on the property. | Land | Improvement |
|---|---|---|---|---|
| 2025 | $3,161 | $608,400 | $212,200 | $396,200 |
| 2024 | $3,161 | $598,900 | $199,100 | $399,800 |
| 2023 | $2,903 | $549,600 | $189,200 | $360,400 |
| 2022 | $2,905 | $541,000 | $185,500 | $355,500 |
| 2021 | $2,594 | $411,600 | $155,300 | $256,300 |
| 2020 | $2,470 | $370,100 | $155,300 | $214,800 |
| 2019 | $2,301 | $336,500 | $146,500 | $190,000 |
| 2018 | $2,058 | $315,200 | $146,500 | $168,700 |
| 2017 | $2,020 | $296,100 | $146,500 | $149,600 |
| 2016 | $2,008 | $299,200 | $146,500 | $152,700 |
| 2015 | $1,905 | $250,400 | $148,000 | $102,400 |
| 2014 | $1,848 | $238,700 | $143,600 | $95,100 |
Source: Public Records
Map
Nearby Homes
- 8935 Quarry Stone Way
- 1368 Silvercrest Dr
- 1482 Waters Ln
- 1393 E Galaxie Dr
- 9277 S 1520 E
- 1616 Waters Ln
- 1492 E Sandy Hills Dr
- 1430 E 8685 S
- 1100 E Webster Dr
- 9083 Enchanted Oak Ln
- 9144 S Peach Blossom Dr
- 9092 Enchanted Oak Ln
- 8643 Vaquero Dr
- 9439 S Meckailee Cove
- 8731 Gladiator Way
- 807 E Whisper Cove Rd
- 9633 S 1210 E
- 9464 S Meckailee Cove
- 8657 S 910 E
- 1356 Eastpoint Dr
- 9076 Hummingbird Cir
- 9084 Hummingbird Ln
- 9060 S Hummingbird Cir
- 9060 Hummingbird Cir
- 9070 Hummingbird Cir
- 9070 S Hummingbird Cir
- 1235 Quail Creek Dr
- 9059 S Hummingbird Cir
- 9059 Hummingbird Cir
- 9096 S Hummingbird Ln
- 9096 Hummingbird Ln
- 1044 E Quail Creek Dr Unit L
- 9063 Hummingbird Cir
- 9108 Hummingbird Ln
- 1249 Quail Creek Dr
- 1249 E Quail Creek Dr
- 9069 S Hummingbird Cir
- 9111 Hummingbird Ln
- 9111 S Hummingbird Ln Unit 50
- 9111 S Hummingbird Ln