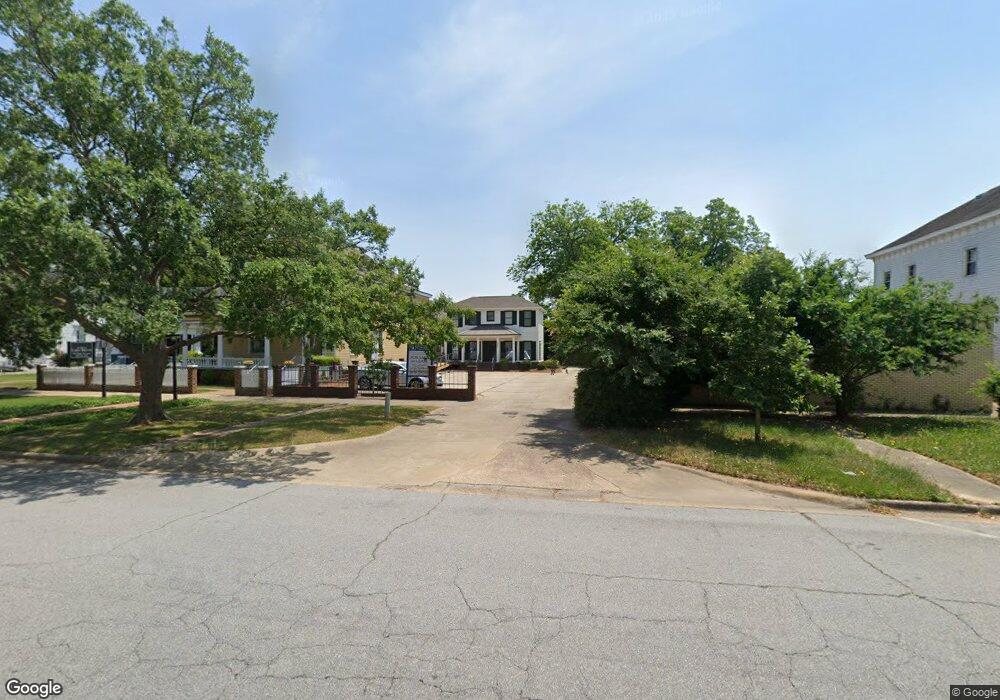
908 2nd Ave Columbus, GA 31901
Uptown NeighborhoodEstimated Value: $664,432
--
Bed
1
Bath
6,667
Sq Ft
$100/Sq Ft
Est. Value
About This Home
This home is located at 908 2nd Ave, Columbus, GA 31901 and is currently estimated at $664,432, approximately $99 per square foot. 908 2nd Ave is a home located in Muscogee County with nearby schools including Downtown Elementary Magnet Academy, Davis Elementary School, and Double Churches Middle School.
Ownership History
Date
Name
Owned For
Owner Type
Purchase Details
Closed on
Mar 14, 2023
Sold by
908 Limited Liability Company
Bought by
Elliot Aleisha and Muller James
Current Estimated Value
Home Financials for this Owner
Home Financials are based on the most recent Mortgage that was taken out on this home.
Original Mortgage
$452,000
Outstanding Balance
$243,212
Interest Rate
6.12%
Mortgage Type
New Conventional
Estimated Equity
$421,220
Purchase Details
Closed on
Mar 16, 2015
Sold by
Pinter V Alexander
Bought by
Graystone Llc
Purchase Details
Closed on
Jun 24, 2008
Sold by
Wade W Wright and Arnold Joseph S
Bought by
908 Llc
Home Financials for this Owner
Home Financials are based on the most recent Mortgage that was taken out on this home.
Original Mortgage
$520,000
Interest Rate
6.21%
Mortgage Type
Commercial
Create a Home Valuation Report for This Property
The Home Valuation Report is an in-depth analysis detailing your home's value as well as a comparison with similar homes in the area
Home Values in the Area
Average Home Value in this Area
Purchase History
| Date | Buyer | Sale Price | Title Company |
|---|---|---|---|
| Elliot Aleisha | $565,000 | -- | |
| Graystone Llc | $250,000 | -- | |
| 908 Llc | -- | None Available |
Source: Public Records
Mortgage History
| Date | Status | Borrower | Loan Amount |
|---|---|---|---|
| Open | Elliot Aleisha | $452,000 | |
| Previous Owner | 908 Llc | $520,000 |
Source: Public Records
Tax History Compared to Growth
Tax History
| Year | Tax Paid | Tax Assessment Tax Assessment Total Assessment is a certain percentage of the fair market value that is determined by local assessors to be the total taxable value of land and additions on the property. | Land | Improvement |
|---|---|---|---|---|
| 2025 | $10,469 | $226,924 | $59,588 | $167,336 |
| 2024 | $10,427 | $226,000 | $59,320 | $166,680 |
| 2023 | $9,410 | $202,876 | $59,588 | $143,288 |
| 2022 | $9,132 | $190,956 | $59,588 | $131,368 |
| 2021 | $8,332 | $174,228 | $59,588 | $114,640 |
| 2020 | $8,334 | $196,860 | $59,588 | $137,272 |
| 2019 | $6,980 | $171,212 | $26,816 | $144,396 |
| 2018 | $8,212 | $171,212 | $26,816 | $144,396 |
| 2017 | $8,234 | $171,212 | $26,816 | $144,396 |
| 2016 | $8,235 | $170,715 | $29,560 | $141,155 |
| 2015 | $6,595 | $170,715 | $29,560 | $141,155 |
| 2014 | $3,301 | $170,715 | $29,560 | $141,155 |
| 2013 | -- | $170,715 | $29,560 | $141,155 |
Source: Public Records
Map
Nearby Homes
- 820 2nd Ave
- 816 2nd Ave
- 804 2nd Ave
- 731 2nd Ave
- 215 7th St
- 731 Broadway
- 1204 1st Ave Unit 303
- 600 Broadway
- 1201 Front Ave Unit 514
- 1201 Front Ave Unit 203
- 1201 Front Ave Unit 222
- 1201 Front Ave
- 1201 Front Ave Unit 507
- 511 2nd Ave
- 508 3rd Ave
- 437 2nd Ave
- 304 11th St S
- 1103 Martin Luther King Junior Blvd
- 912 Magnolia Ave
- 911 Oakview Ave