908 5th Ave Akron, OH 44306
East Akron NeighborhoodEstimated Value: $68,000 - $85,000
3
Beds
1
Bath
1,192
Sq Ft
$62/Sq Ft
Est. Value
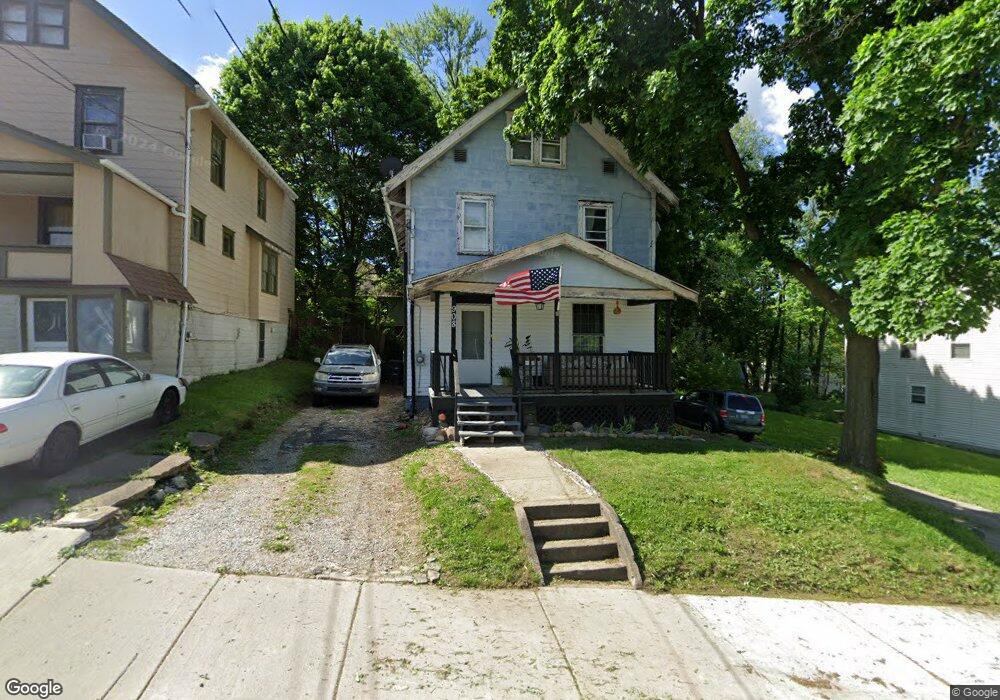
About This Home
This home is located at 908 5th Ave, Akron, OH 44306 and is currently estimated at $74,388, approximately $62 per square foot. 908 5th Ave is a home located in Summit County with nearby schools including Glover Community Learning Center, Kenmore Garfield Community Learning Center, and Case Preparatory Academy.
Ownership History
Date
Name
Owned For
Owner Type
Purchase Details
Closed on
Sep 20, 2022
Sold by
Seth Wilson
Bought by
Clapper Michael
Current Estimated Value
Purchase Details
Closed on
Aug 7, 2019
Sold by
Pringle Kelly
Bought by
Willison Seth
Purchase Details
Closed on
Jun 18, 2015
Sold by
Quinn Paul and Quinn Janice
Bought by
Quinn Lisa
Purchase Details
Closed on
Mar 13, 2015
Sold by
Quinn Lisa
Bought by
Pringle Kelly
Purchase Details
Closed on
Dec 23, 2014
Sold by
Quinn Mark D
Bought by
Quinn Lisa
Create a Home Valuation Report for This Property
The Home Valuation Report is an in-depth analysis detailing your home's value as well as a comparison with similar homes in the area
Home Values in the Area
Average Home Value in this Area
Purchase History
| Date | Buyer | Sale Price | Title Company |
|---|---|---|---|
| Clapper Michael | $500 | -- | |
| Willison Seth | -- | None Available | |
| Quinn Lisa | -- | None Available | |
| Quinn Lisa | -- | None Available | |
| Pringle Kelly | $6,000,000 | Attorney | |
| Quinn Lisa | -- | None Available | |
| Quinn Lisa | -- | None Available |
Source: Public Records
Tax History Compared to Growth
Tax History
| Year | Tax Paid | Tax Assessment Tax Assessment Total Assessment is a certain percentage of the fair market value that is determined by local assessors to be the total taxable value of land and additions on the property. | Land | Improvement |
|---|---|---|---|---|
| 2025 | $3,291 | $15,775 | $3,791 | $11,984 |
| 2024 | $1,062 | $15,775 | $3,791 | $11,984 |
| 2023 | $3,291 | $15,775 | $3,791 | $11,984 |
| 2022 | $2,067 | $9,279 | $2,230 | $7,049 |
| 2021 | $754 | $9,279 | $2,230 | $7,049 |
| 2020 | $845 | $9,280 | $2,230 | $7,050 |
| 2019 | $134 | $6,250 | $3,770 | $2,480 |
| 2018 | $76 | $6,250 | $3,770 | $2,480 |
| 2017 | $534 | $6,250 | $3,770 | $2,480 |
| 2016 | $522 | $6,300 | $3,770 | $2,530 |
| 2015 | $534 | $13,090 | $3,770 | $9,320 |
| 2014 | $1,527 | $13,090 | $3,770 | $9,320 |
| 2013 | $1,094 | $13,710 | $3,770 | $9,940 |
Source: Public Records
Map
Nearby Homes