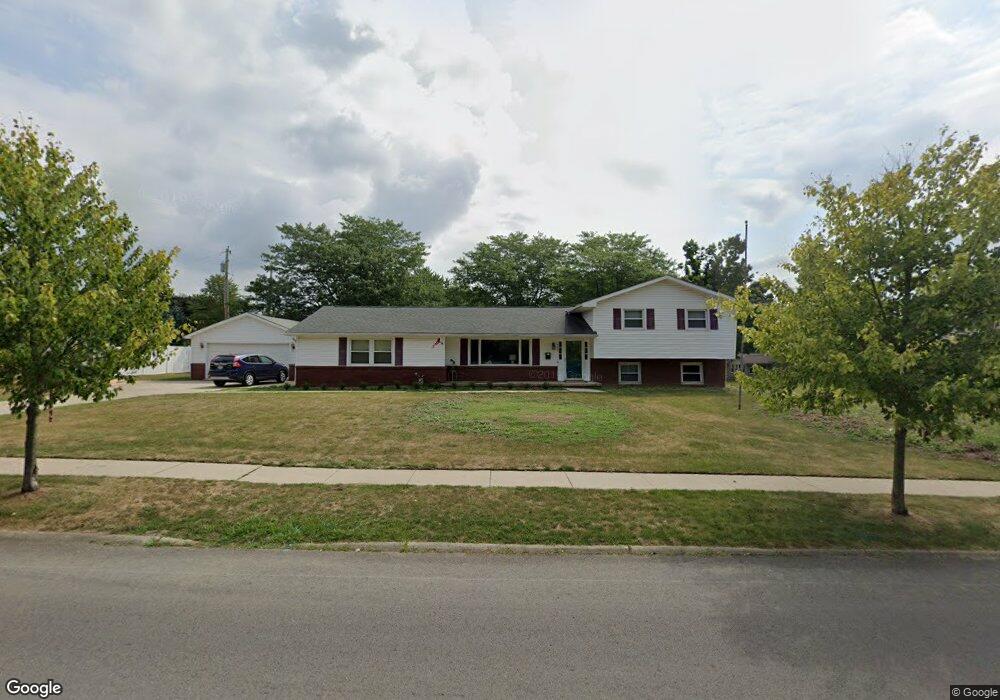
908 Allison Rd Bellefontaine, OH 43311
Estimated Value: $311,000 - $354,000
3
Beds
3
Baths
2,696
Sq Ft
$119/Sq Ft
Est. Value
About This Home
This home is located at 908 Allison Rd, Bellefontaine, OH 43311 and is currently estimated at $321,878, approximately $119 per square foot. 908 Allison Rd is a home located in Logan County with nearby schools including Bellefontaine Elementary School, Bellefontaine Intermediate School, and Bellefontaine Middle School.
Ownership History
Date
Name
Owned For
Owner Type
Purchase Details
Closed on
Aug 16, 2019
Sold by
Miller Douglas S and Miller Jodie L
Bought by
Reminder Jonathan M and Reminder Makenzie J
Current Estimated Value
Home Financials for this Owner
Home Financials are based on the most recent Mortgage that was taken out on this home.
Original Mortgage
$170,000
Outstanding Balance
$148,889
Interest Rate
3.7%
Mortgage Type
New Conventional
Estimated Equity
$172,989
Purchase Details
Closed on
Mar 7, 2019
Sold by
The Weeks Irrevocable Heritage Trust
Bought by
Miller Douglas S and Miller Jodie L
Home Financials for this Owner
Home Financials are based on the most recent Mortgage that was taken out on this home.
Original Mortgage
$168,500
Interest Rate
4.5%
Mortgage Type
Adjustable Rate Mortgage/ARM
Create a Home Valuation Report for This Property
The Home Valuation Report is an in-depth analysis detailing your home's value as well as a comparison with similar homes in the area
Home Values in the Area
Average Home Value in this Area
Purchase History
| Date | Buyer | Sale Price | Title Company |
|---|---|---|---|
| Reminder Jonathan M | $170,000 | None Available | |
| Miller Douglas S | $136,500 | None Available |
Source: Public Records
Mortgage History
| Date | Status | Borrower | Loan Amount |
|---|---|---|---|
| Open | Reminder Jonathan M | $170,000 | |
| Previous Owner | Miller Douglas S | $168,500 |
Source: Public Records
Tax History Compared to Growth
Tax History
| Year | Tax Paid | Tax Assessment Tax Assessment Total Assessment is a certain percentage of the fair market value that is determined by local assessors to be the total taxable value of land and additions on the property. | Land | Improvement |
|---|---|---|---|---|
| 2024 | $2,836 | $72,030 | $19,720 | $52,310 |
| 2023 | $2,836 | $72,030 | $19,720 | $52,310 |
| 2022 | $3,035 | $65,380 | $15,170 | $50,210 |
| 2021 | $2,906 | $65,380 | $15,170 | $50,210 |
| 2020 | $2,908 | $56,550 | $11,380 | $45,170 |
| 2019 | $3,038 | $56,550 | $11,380 | $45,170 |
| 2018 | $2,228 | $56,550 | $11,380 | $45,170 |
| 2016 | $2,231 | $56,550 | $11,380 | $45,170 |
| 2014 | $1,862 | $56,550 | $11,380 | $45,170 |
| 2013 | $1,861 | $56,550 | $11,380 | $45,170 |
| 2012 | $2,019 | $61,960 | $11,380 | $50,580 |
Source: Public Records
Map
Nearby Homes