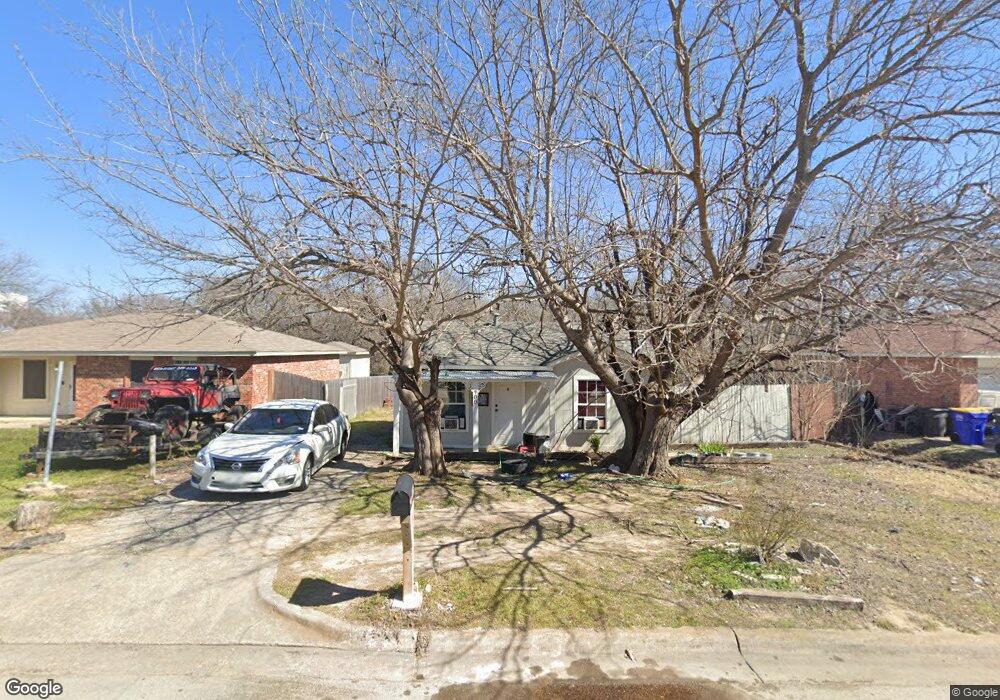
908 Bourland Dr Fort Worth, TX 76108
Estimated Value: $170,000 - $264,000
1
Bed
1
Bath
480
Sq Ft
$410/Sq Ft
Est. Value
About This Home
This home is located at 908 Bourland Dr, Fort Worth, TX 76108 and is currently estimated at $196,745, approximately $409 per square foot. 908 Bourland Dr is a home located in Tarrant County with nearby schools including North Elementary School, Brewer Middle School, and Tannahill Intermediate School.
Ownership History
Date
Name
Owned For
Owner Type
Purchase Details
Closed on
Jul 20, 2016
Sold by
Montroll Nicholas H and Montroll Jennah Wood
Bought by
Chavira Maria Ortiz
Current Estimated Value
Purchase Details
Closed on
Jul 7, 2004
Sold by
Hud
Bought by
Montroll Nicholas H
Purchase Details
Closed on
Dec 3, 2003
Sold by
Chase Manhattan Mortgage Corp
Bought by
Hud
Purchase Details
Closed on
Dec 2, 2003
Sold by
Lara Angie Ann
Bought by
Chase Manhattan Mortgage Corp
Purchase Details
Closed on
Nov 7, 1996
Sold by
Davidson Scott R
Bought by
Lara Angie Ann
Home Financials for this Owner
Home Financials are based on the most recent Mortgage that was taken out on this home.
Original Mortgage
$21,165
Interest Rate
8.05%
Mortgage Type
FHA
Purchase Details
Closed on
Mar 7, 1995
Sold by
Hud
Bought by
Davidson Scott R
Purchase Details
Closed on
May 5, 1994
Sold by
Lee Claudette
Bought by
Hud
Create a Home Valuation Report for This Property
The Home Valuation Report is an in-depth analysis detailing your home's value as well as a comparison with similar homes in the area
Home Values in the Area
Average Home Value in this Area
Purchase History
| Date | Buyer | Sale Price | Title Company |
|---|---|---|---|
| Chavira Maria Ortiz | -- | Rtc | |
| Montroll Nicholas H | -- | -- | |
| Hud | -- | -- | |
| Chase Manhattan Mortgage Corp | $25,404 | -- | |
| Lara Angie Ann | -- | Fidelity National Title | |
| Davidson Scott R | -- | -- | |
| Hud | -- | -- |
Source: Public Records
Mortgage History
| Date | Status | Borrower | Loan Amount |
|---|---|---|---|
| Previous Owner | Lara Angie Ann | $21,165 |
Source: Public Records
Tax History Compared to Growth
Tax History
| Year | Tax Paid | Tax Assessment Tax Assessment Total Assessment is a certain percentage of the fair market value that is determined by local assessors to be the total taxable value of land and additions on the property. | Land | Improvement |
|---|---|---|---|---|
| 2025 | $2,021 | $89,115 | $45,545 | $43,570 |
| 2024 | $2,021 | $89,115 | $45,545 | $43,570 |
| 2023 | $2,021 | $85,000 | $45,545 | $39,455 |
| 2022 | $1,591 | $58,758 | $25,000 | $33,758 |
| 2021 | $1,660 | $60,350 | $25,000 | $35,350 |
| 2020 | $1,812 | $65,379 | $25,000 | $40,379 |
| 2019 | $1,902 | $66,131 | $25,000 | $41,131 |
| 2018 | $1,292 | $44,918 | $11,000 | $33,918 |
| 2017 | $1,061 | $36,320 | $11,000 | $25,320 |
| 2016 | $1,358 | $46,472 | $11,000 | $35,472 |
| 2015 | $767 | $26,700 | $11,000 | $15,700 |
| 2014 | $767 | $26,700 | $11,000 | $15,700 |
Source: Public Records
Map
Nearby Homes
- 857 Mccully St
- 914 Ronald St
- 8133 Foxfire Ln
- 8113 Foxfire Ln
- 8257 Killdeer Cir
- 813 Hackamore St
- 8417 Omaha Dr
- 633 Lariat Ln
- 1800 N Las Vegas Trail
- 8814 Rockway St
- 8401 Clifford St
- 627 Hallvale Dr
- 8832 Kate St
- 8811 Silver Creek Rd
- 311 Russell St
- 8113 Raymond Ave
- 410 N Cherry Ln
- 200 Waynell St
- 9752 New Bern Dr
- 8321 Raymond Ave
- 912 Bourland Dr
- 904 Bourland Dr
- 904 Bourland Dr
- 900 Bourland Dr
- 916 Bourland Dr
- 920 Bourland Dr
- 800 Bourland Dr
- 909 Bourland Dr
- 907 Bourland Dr
- 915 Bourland Dr
- 903 Bourland Dr
- 903 Bourland Dr
- 924 Bourland Dr
- 919 Bourland Dr
- 923 Bourland Dr
- 928 Bourland Dr
- 927 Bourland Dr
- 932 Bourland Dr
- 908 Mccully St
- 931 Bourland Dr