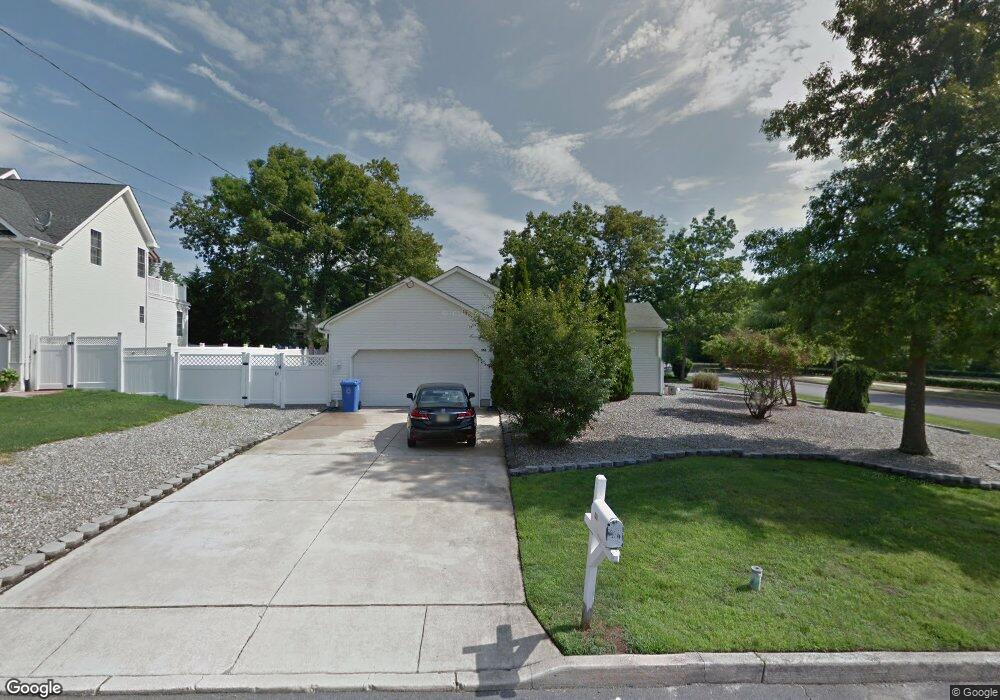
908 Canoe Ln Manahawkin, NJ 08050
Stafford NeighborhoodEstimated Value: $470,000 - $526,000
2
Beds
3
Baths
1,436
Sq Ft
$342/Sq Ft
Est. Value
About This Home
This home is located at 908 Canoe Ln, Manahawkin, NJ 08050 and is currently estimated at $491,380, approximately $342 per square foot. 908 Canoe Ln is a home located in Ocean County with nearby schools including Ocean Acres Elementary School, Oxycocus Elementary School, and McKinley Avenue Elementary School.
Ownership History
Date
Name
Owned For
Owner Type
Purchase Details
Closed on
Apr 23, 2009
Sold by
Greene Lucy R
Bought by
Cramer Christopher S
Current Estimated Value
Home Financials for this Owner
Home Financials are based on the most recent Mortgage that was taken out on this home.
Original Mortgage
$180,000
Outstanding Balance
$113,299
Interest Rate
4.86%
Mortgage Type
Purchase Money Mortgage
Estimated Equity
$378,081
Purchase Details
Closed on
Oct 10, 1997
Sold by
Danner Charlene E
Bought by
Entrikin Sara W and Entrikin Helen S
Create a Home Valuation Report for This Property
The Home Valuation Report is an in-depth analysis detailing your home's value as well as a comparison with similar homes in the area
Home Values in the Area
Average Home Value in this Area
Purchase History
| Date | Buyer | Sale Price | Title Company |
|---|---|---|---|
| Cramer Christopher S | $225,000 | Commonwealth Land Title Insu | |
| Entrikin Sara W | $39,000 | Amalgamated Title Abstract C |
Source: Public Records
Mortgage History
| Date | Status | Borrower | Loan Amount |
|---|---|---|---|
| Open | Cramer Christopher S | $180,000 |
Source: Public Records
Tax History Compared to Growth
Tax History
| Year | Tax Paid | Tax Assessment Tax Assessment Total Assessment is a certain percentage of the fair market value that is determined by local assessors to be the total taxable value of land and additions on the property. | Land | Improvement |
|---|---|---|---|---|
| 2025 | $5,507 | $221,800 | $67,200 | $154,600 |
| 2024 | $5,454 | $221,800 | $67,200 | $154,600 |
| 2023 | $5,221 | $221,800 | $67,200 | $154,600 |
| 2022 | $5,221 | $221,800 | $67,200 | $154,600 |
| 2021 | $5,150 | $221,800 | $67,200 | $154,600 |
| 2020 | $5,157 | $221,800 | $67,200 | $154,600 |
| 2019 | $5,084 | $221,800 | $67,200 | $154,600 |
| 2018 | $5,053 | $221,800 | $67,200 | $154,600 |
| 2017 | $5,028 | $213,700 | $67,200 | $146,500 |
| 2016 | $4,977 | $213,700 | $67,200 | $146,500 |
| 2015 | $4,802 | $213,700 | $67,200 | $146,500 |
| 2014 | $4,725 | $207,700 | $66,400 | $141,300 |
Source: Public Records
Map
Nearby Homes
- 909 Bonita Ln
- 200 Cutter Ln
- 217 Middie Ln
- 1034 Buccaneer Ln
- 220 Middie Ln
- 4 Fair Oaks Dr
- 223 Serpent Ln
- 126 Trim Ln
- 121 Trim Ln
- 0 Levi's Rd
- 0 Levi Rd Unit NJOC2030756
- 55 Holloway Ave
- 274 Beachview Ave
- 208 Steering Ln
- 31 4 Mile Ave
- 25 Cannonball Dr
- 20 Samuel Dr
- 372 Nautilus Dr
- 34 Samuel Dr
- 159 Edenton Dr