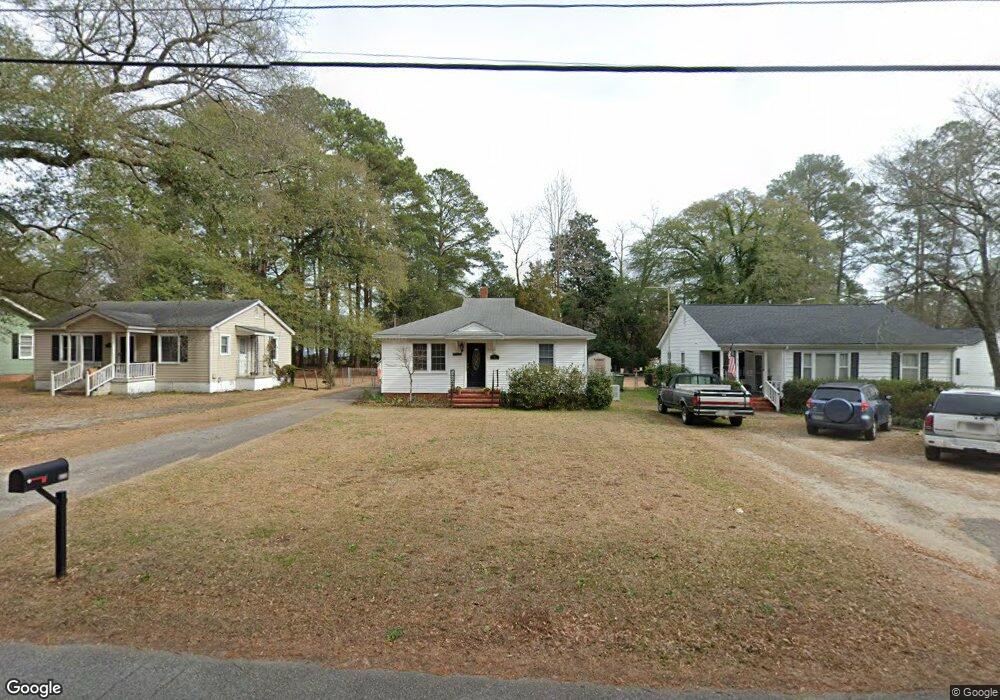
908 Cheraw Dr Florence, SC 29501
Estimated Value: $124,000 - $170,000
3
Beds
1
Bath
992
Sq Ft
$144/Sq Ft
Est. Value
About This Home
This home is located at 908 Cheraw Dr, Florence, SC 29501 and is currently estimated at $142,641, approximately $143 per square foot. 908 Cheraw Dr is a home located in Florence County with nearby schools including Royall Elementary School, John W. Moore Middle School, and Henry L. Sneed Middle School.
Ownership History
Date
Name
Owned For
Owner Type
Purchase Details
Closed on
Jun 9, 2020
Sold by
Bailey David T and Bailey Deborah L
Bought by
Mcclaman Felix
Current Estimated Value
Purchase Details
Closed on
May 19, 2020
Sold by
Bailey Grace Elizabeth
Bought by
Bailey David T and Bailey Deborah L
Purchase Details
Closed on
Jun 6, 2019
Sold by
Bailey David T
Bought by
Bailey Grace Elizabeth
Purchase Details
Closed on
Jun 20, 2016
Sold by
Bailey David T and Bailey Deborah L
Bought by
Bailey Grace Elizabeth
Purchase Details
Closed on
Jun 8, 2011
Sold by
Bailey David T and Bailey Deborah L
Bought by
Bailey Andrew David and Bailey Grace Elizabeth
Purchase Details
Closed on
Mar 20, 2007
Sold by
Bailey David T and Bailey Deborah L
Bought by
Bailey Andrew David and Bailey Grace Elizabeth
Purchase Details
Closed on
Apr 10, 2003
Sold by
Bailey David T and Bailey Deborah L
Bought by
Bailey Andrew David
Purchase Details
Closed on
Feb 19, 2003
Sold by
Taylor Elizabeth Siau
Bought by
Bailey David T and Bailey Deborah L
Create a Home Valuation Report for This Property
The Home Valuation Report is an in-depth analysis detailing your home's value as well as a comparison with similar homes in the area
Home Values in the Area
Average Home Value in this Area
Purchase History
| Date | Buyer | Sale Price | Title Company |
|---|---|---|---|
| Mcclaman Felix | $87,530 | None Available | |
| Bailey David T | -- | None Available | |
| Bailey Grace Elizabeth | -- | None Available | |
| Bailey Grace Elizabeth | -- | -- | |
| Bailey Andrew David | -- | -- | |
| Bailey Andrew David | -- | None Available | |
| Bailey Andrew David | -- | -- | |
| Bailey David T | $68,500 | -- |
Source: Public Records
Tax History Compared to Growth
Tax History
| Year | Tax Paid | Tax Assessment Tax Assessment Total Assessment is a certain percentage of the fair market value that is determined by local assessors to be the total taxable value of land and additions on the property. | Land | Improvement |
|---|---|---|---|---|
| 2024 | $206 | $4,801 | $600 | $4,201 |
| 2023 | $159 | $3,488 | $600 | $2,888 |
| 2022 | $217 | $3,488 | $600 | $2,888 |
| 2021 | $457 | $3,490 | $0 | $0 |
| 2020 | $1,473 | $2,760 | $0 | $0 |
| 2019 | $1,449 | $4,140 | $0 | $0 |
| 2018 | $1,279 | $3,810 | $0 | $0 |
| 2017 | $1,254 | $3,810 | $0 | $0 |
| 2016 | $1,217 | $3,810 | $0 | $0 |
| 2015 | $1,217 | $3,810 | $0 | $0 |
| 2014 | $1,162 | $0 | $0 | $0 |
Source: Public Records
Map
Nearby Homes
- 1007 S Edisto Dr
- 1024 Woodstone Dr
- 1404 Cherokee Rd
- 904 Beverly Dr
- 906 Sherwood Dr
- 1001 Lindberg Dr
- 1152 Brunwood Dr
- 1505 Tanglewood Cir
- 1713 Cherokee Rd
- 965 Scriven Dr
- 1170 S Edisto Dr
- 1400 Jackson Ave
- 1602 Cherokee Rd
- 906 Cherokee Rd
- 600 Greenway Dr
- 1211 Jackson Ave
- 916 Kalmia St
- 601 Greenway Dr
- 808 Juanita Dr
- 1315 Madison Ave