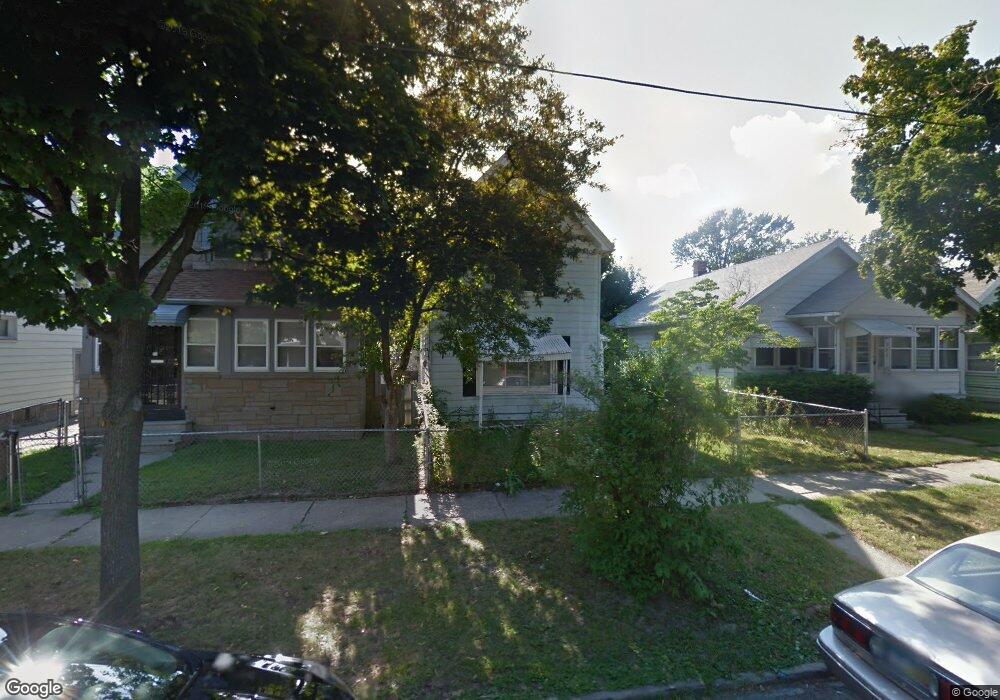
908 Clark St Toledo, OH 43605
East Toledo NeighborhoodEstimated Value: $29,000 - $64,000
3
Beds
1
Bath
1,096
Sq Ft
$50/Sq Ft
Est. Value
About This Home
This home is located at 908 Clark St, Toledo, OH 43605 and is currently estimated at $54,357, approximately $49 per square foot. 908 Clark St is a home located in Lucas County with nearby schools including Navarre Elementary School, Waite High School, and L. Hollingworth School For Talented And Gifted.
Ownership History
Date
Name
Owned For
Owner Type
Purchase Details
Closed on
Apr 18, 2020
Sold by
Napolski Christopher M and Napolski Christopher M
Bought by
Justice Joshua
Current Estimated Value
Purchase Details
Closed on
Aug 14, 2018
Sold by
Golden Properties Management
Bought by
Napolski Christopher M and The Christopher M Napolski Rev
Purchase Details
Closed on
Nov 8, 2008
Sold by
Napolski Christopher M and Frutiger Karen
Bought by
Golden Properties Management-908 Clark S
Purchase Details
Closed on
Oct 24, 2008
Sold by
Fannie Mae
Bought by
Napolski Christopher M
Purchase Details
Closed on
Apr 8, 2008
Sold by
Tyler Christian D and Gmac Mortgage Llc
Bought by
Federal National Mortgage Association
Purchase Details
Closed on
Dec 4, 2000
Sold by
Cornelison Linda
Bought by
Tyler Christian D
Home Financials for this Owner
Home Financials are based on the most recent Mortgage that was taken out on this home.
Original Mortgage
$23,512
Interest Rate
7.86%
Create a Home Valuation Report for This Property
The Home Valuation Report is an in-depth analysis detailing your home's value as well as a comparison with similar homes in the area
Home Values in the Area
Average Home Value in this Area
Purchase History
| Date | Buyer | Sale Price | Title Company |
|---|---|---|---|
| Justice Joshua | -- | None Available | |
| Napolski Christopher M | -- | None Available | |
| Golden Properties Management-908 Clark S | -- | None Available | |
| Napolski Christopher M | $9,000 | Title First Agency | |
| Federal National Mortgage Association | $21,744 | None Available | |
| Tyler Christian D | $24,000 | -- |
Source: Public Records
Mortgage History
| Date | Status | Borrower | Loan Amount |
|---|---|---|---|
| Previous Owner | Tyler Christian D | $23,512 |
Source: Public Records
Tax History
| Year | Tax Paid | Tax Assessment Tax Assessment Total Assessment is a certain percentage of the fair market value that is determined by local assessors to be the total taxable value of land and additions on the property. | Land | Improvement |
|---|---|---|---|---|
| 2025 | $752 | $6,825 | $1,050 | $5,775 |
| 2024 | $1,542 | $6,825 | $1,050 | $5,775 |
| 2023 | $412 | $4,515 | $840 | $3,675 |
| 2022 | $414 | $4,515 | $840 | $3,675 |
| 2021 | $411 | $4,515 | $840 | $3,675 |
| 2020 | $404 | $3,780 | $735 | $3,045 |
| 2019 | $408 | $3,780 | $735 | $3,045 |
| 2018 | $394 | $3,780 | $735 | $3,045 |
| 2017 | $394 | $3,395 | $1,365 | $2,030 |
| 2016 | $386 | $9,700 | $3,900 | $5,800 |
| 2015 | $379 | $9,700 | $3,900 | $5,800 |
| 2014 | $443 | $6,860 | $1,330 | $5,530 |
| 2013 | $443 | $6,860 | $1,330 | $5,530 |
Source: Public Records
Map
Nearby Homes
Your Personal Tour Guide
Ask me questions while you tour the home.