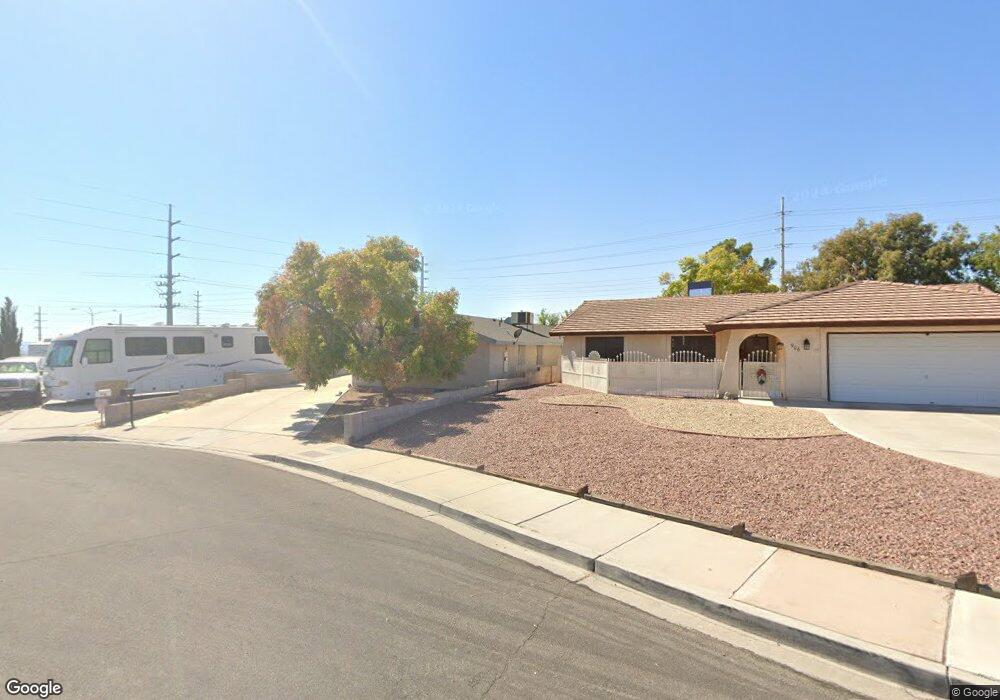
908 Del Sol Dr Unit 3 Boulder City, NV 89005
Estimated Value: $505,169 - $559,000
3
Beds
2
Baths
1,894
Sq Ft
$276/Sq Ft
Est. Value
About This Home
This home is located at 908 Del Sol Dr Unit 3, Boulder City, NV 89005 and is currently estimated at $523,542, approximately $276 per square foot. 908 Del Sol Dr Unit 3 is a home located in Clark County with nearby schools including Andrew Mitchell Elementary School, Martha P. King Elementary School, and Elton M. & Madelaine E. Garrett Junior High School.
Ownership History
Date
Name
Owned For
Owner Type
Purchase Details
Closed on
Dec 12, 2014
Sold by
Rebman Lovina F
Bought by
Rebman Lovina F and Mzfroggy Trust
Current Estimated Value
Home Financials for this Owner
Home Financials are based on the most recent Mortgage that was taken out on this home.
Original Mortgage
$236,000
Outstanding Balance
$181,306
Interest Rate
4%
Mortgage Type
New Conventional
Estimated Equity
$342,236
Purchase Details
Closed on
Sep 27, 2007
Sold by
Rebman Lovina F
Bought by
Rebman Lovina F and Mzfroggy Trust
Purchase Details
Closed on
Apr 21, 2006
Sold by
Rebman Lovina F
Bought by
Rebman Lovina F
Home Financials for this Owner
Home Financials are based on the most recent Mortgage that was taken out on this home.
Original Mortgage
$270,000
Interest Rate
6.29%
Mortgage Type
Fannie Mae Freddie Mac
Purchase Details
Closed on
Dec 12, 2001
Sold by
Lee Herbert M and Lee Beverly F
Bought by
Rebman Lovina F
Home Financials for this Owner
Home Financials are based on the most recent Mortgage that was taken out on this home.
Original Mortgage
$151,900
Interest Rate
7.17%
Create a Home Valuation Report for This Property
The Home Valuation Report is an in-depth analysis detailing your home's value as well as a comparison with similar homes in the area
Home Values in the Area
Average Home Value in this Area
Purchase History
| Date | Buyer | Sale Price | Title Company |
|---|---|---|---|
| Rebman Lovina F | -- | Title Source Inc | |
| Rebman Lovina F | -- | Title Source Inc | |
| Rebman Lovina F | -- | None Available | |
| Rebman Lovina F | -- | Ticor Title Of Nevada Inc | |
| Rebman Lovina F | $185,000 | United Title |
Source: Public Records
Mortgage History
| Date | Status | Borrower | Loan Amount |
|---|---|---|---|
| Open | Rebman Lovina F | $236,000 | |
| Closed | Rebman Lovina F | $270,000 | |
| Previous Owner | Rebman Lovina F | $151,900 |
Source: Public Records
Tax History Compared to Growth
Tax History
| Year | Tax Paid | Tax Assessment Tax Assessment Total Assessment is a certain percentage of the fair market value that is determined by local assessors to be the total taxable value of land and additions on the property. | Land | Improvement |
|---|---|---|---|---|
| 2025 | $2,221 | $113,574 | $54,250 | $59,324 |
| 2024 | $2,156 | $113,574 | $54,250 | $59,324 |
| 2023 | $1,760 | $96,766 | $39,900 | $56,866 |
| 2022 | $2,093 | $84,393 | $31,850 | $52,543 |
| 2021 | $2,032 | $79,167 | $29,050 | $50,117 |
| 2020 | $1,973 | $77,634 | $27,650 | $49,984 |
| 2019 | $1,916 | $75,381 | $25,900 | $49,481 |
| 2018 | $1,860 | $71,349 | $23,450 | $47,899 |
| 2017 | $1,888 | $72,287 | $23,450 | $48,837 |
| 2016 | $1,760 | $67,993 | $18,900 | $49,093 |
| 2015 | $1,757 | $66,215 | $17,500 | $48,715 |
| 2014 | $1,705 | $64,556 | $17,500 | $47,056 |
Source: Public Records
Map
Nearby Homes
- 873 Montera Ln
- 871 Armada Place
- 855 Del Rey Dr
- 834 Benita Place
- 839 Benita Place
- 1414 Cattail Falls St
- 1319 Red Baron Ln
- 976 El Camino Way
- 1437 Cattail Falls St
- 1505 Carlsbad St
- 820 A Ave
- 523 Fir St
- 870 B Unit 103
- 518 Elm St Unit C
- 1412 5th St
- 1000 Legacy Dr
- 1321 Nadine Way
- 782 Sandra Dr
- 1010 Legacy Dr
- 1317 Yucca St
- 906 Del Sol Dr
- 910 Del Sol Dr
- 877 Montera Ln
- 904 Del Sol Dr
- 875 Montera Ln
- 902 Del Sol Dr
- 1208 Briarstone Dr
- 1210 Briarstone Dr
- 907 Del Sol Dr
- 1212 Briarstone Dr
- 1214 Briarstone Dr
- 1206 Briarstone Dr
- 900 Del Sol Dr
- 871 Montera Ln
- 870 Montera Ln
- 903 Del Sol Dr
- 1205 Briarstone Dr
- 1204 Briarstone Dr
- 1215 Briarstone Dr
- 869 Montera Ln