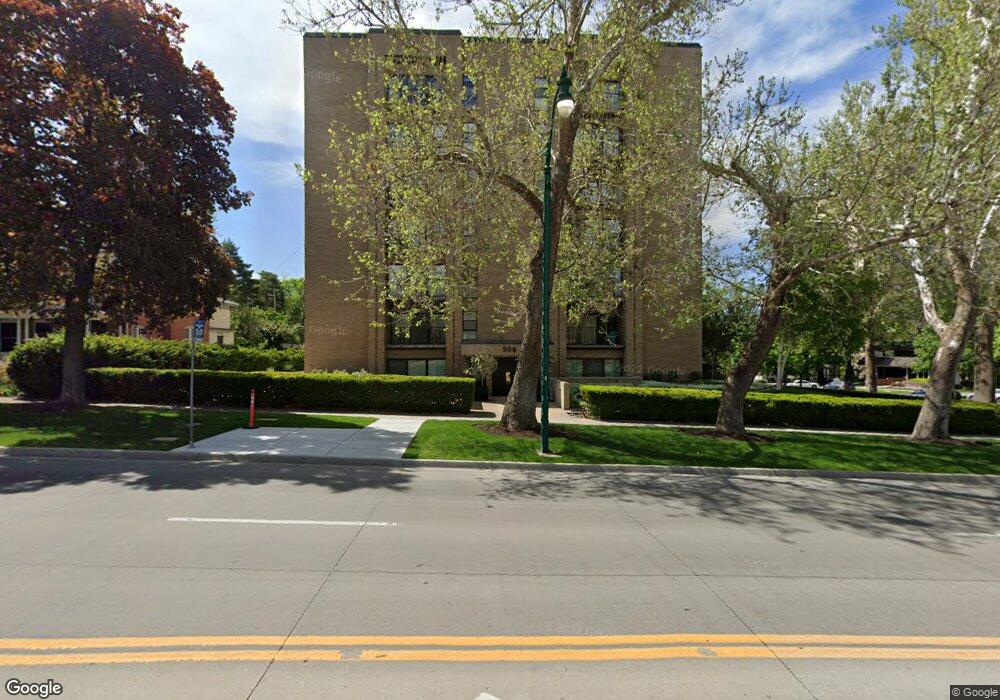
908 E South Temple Unit 1W Salt Lake City, UT 84102
East Central NeighborhoodEstimated Value: $949,000 - $1,136,858
2
Beds
3
Baths
2,464
Sq Ft
$434/Sq Ft
Est. Value
About This Home
This home is located at 908 E South Temple Unit 1W, Salt Lake City, UT 84102 and is currently estimated at $1,068,715, approximately $433 per square foot. 908 E South Temple Unit 1W is a home located in Salt Lake County with nearby schools including Wasatch Elementary School, East High School, and Open Classroom.
Ownership History
Date
Name
Owned For
Owner Type
Purchase Details
Closed on
Dec 1, 2016
Sold by
Bigelow Robert and Bigelow Jane
Bought by
Bigelow Robert E and Bigelow Jane G
Current Estimated Value
Home Financials for this Owner
Home Financials are based on the most recent Mortgage that was taken out on this home.
Original Mortgage
$417,000
Outstanding Balance
$336,720
Interest Rate
3.52%
Mortgage Type
New Conventional
Estimated Equity
$731,995
Purchase Details
Closed on
Mar 29, 2013
Sold by
East Downtown Llc
Bought by
Kraus Kenneth M and Miller Julia D
Home Financials for this Owner
Home Financials are based on the most recent Mortgage that was taken out on this home.
Original Mortgage
$417,000
Interest Rate
3.49%
Mortgage Type
New Conventional
Purchase Details
Closed on
Jan 14, 1999
Sold by
Bennion John W
Bought by
East Downtown Llc
Create a Home Valuation Report for This Property
The Home Valuation Report is an in-depth analysis detailing your home's value as well as a comparison with similar homes in the area
Home Values in the Area
Average Home Value in this Area
Purchase History
| Date | Buyer | Sale Price | Title Company |
|---|---|---|---|
| Bigelow Robert E | -- | Accommodation | |
| Bigelow Robert | -- | Highland Title Agency | |
| Kraus Kenneth M | -- | Backman Title Services | |
| East Downtown Llc | -- | Title West |
Source: Public Records
Mortgage History
| Date | Status | Borrower | Loan Amount |
|---|---|---|---|
| Open | Bigelow Robert | $417,000 | |
| Previous Owner | Kraus Kenneth M | $417,000 |
Source: Public Records
Tax History Compared to Growth
Tax History
| Year | Tax Paid | Tax Assessment Tax Assessment Total Assessment is a certain percentage of the fair market value that is determined by local assessors to be the total taxable value of land and additions on the property. | Land | Improvement |
|---|---|---|---|---|
| 2025 | $4,848 | $940,800 | $282,200 | $658,600 |
| 2024 | $4,848 | $925,100 | $277,500 | $647,600 |
| 2023 | $4,523 | $755,400 | $226,600 | $528,800 |
| 2022 | $4,523 | $780,500 | $234,100 | $546,400 |
| 2021 | $5,466 | $854,000 | $256,200 | $597,800 |
| 2020 | $5,166 | $768,200 | $230,400 | $537,800 |
| 2019 | $5,156 | $721,400 | $216,400 | $505,000 |
| 2018 | $0 | $660,300 | $198,100 | $462,200 |
| 2017 | $4,619 | $589,500 | $176,800 | $412,700 |
| 2016 | $5,134 | $622,300 | $186,700 | $435,600 |
| 2015 | $5,153 | $592,000 | $177,600 | $414,400 |
| 2014 | $5,143 | $586,100 | $175,800 | $410,300 |
Source: Public Records
Map
Nearby Homes
- 908 E South Temple Unit 3E
- 35 S Haxton Place
- 839 E South Temple Unit 102
- 839 E South Temple Unit 99
- 838 S Temple St S Unit 206
- 838 E South Temple Unit 303
- 838 E South Temple Unit 409
- 845 E 100 S Unit 201
- 827 E 100 S
- 821 E 100 S
- 777 E South Temple St Unit 4I
- 777 E South Temple St Unit 6F
- 777 E South Temple Unit 10d
- 777 E South Temple Unit 3F
- 777 E South Temple Unit 13B
- 777 E South Temple Unit 4B
- 777 E South Temple Unit 4A
- 777 E South Temple Unit 13A
- 777 E South Temple Unit 9J
- 777 E South Temple Unit 11F
- 908 E South Temple Unit 1E
- 908 E South Temple Unit 2E
- 908 E South Temple Unit 5W
- 908 E South Temple Unit 3W
- 908 E South Temple Unit 4W
- 908 E South Temple Unit 4E
- 908 E South Temple Unit 7E
- 908 E South Temple Unit 2W
- 908 E South Temple Unit 6W
- 908 E South Temple Unit 5E
- 908 E South Temple Unit 7W
- 908 E South Temple Unit IE
- 908 E South Temple
- 908 E South Temple Unit 2
- 920 E South Temple
- 4 Haxton Place
- 926 E South Temple
- 12 Haxton Place
- 12 S Haxton Place
- 4 S Haxton Place