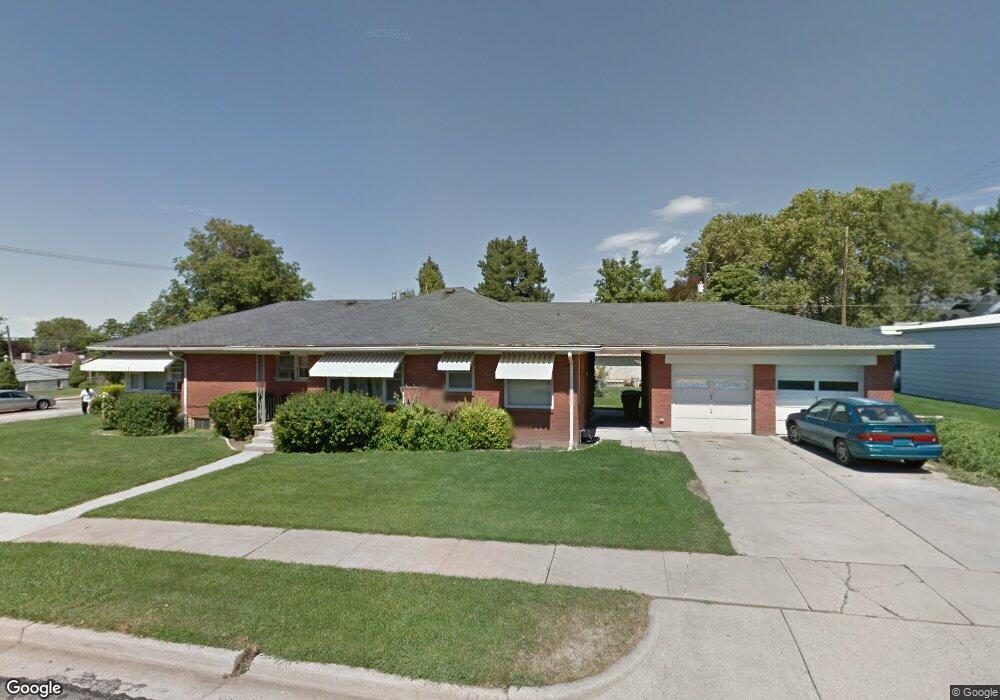
908 Goddard St Ogden, UT 84403
TO Smith NeighborhoodEstimated Value: $464,000 - $515,902
4
Beds
2
Baths
3,412
Sq Ft
$146/Sq Ft
Est. Value
About This Home
This home is located at 908 Goddard St, Ogden, UT 84403 and is currently estimated at $497,726, approximately $145 per square foot. 908 Goddard St is a home located in Weber County with nearby schools including Mount Ogden Junior High School, Ogden High School, and St Joseph Catholic School.
Ownership History
Date
Name
Owned For
Owner Type
Purchase Details
Closed on
Nov 8, 2021
Sold by
Fred Galvez Jr Family Trust
Bought by
Cook Mckade
Current Estimated Value
Home Financials for this Owner
Home Financials are based on the most recent Mortgage that was taken out on this home.
Original Mortgage
$293,250
Outstanding Balance
$267,813
Interest Rate
3.05%
Mortgage Type
New Conventional
Estimated Equity
$229,913
Purchase Details
Closed on
Sep 5, 2017
Sold by
Galvez Fred
Bought by
Galvez Fred and The Fred Galvez Jr Family Trust
Purchase Details
Closed on
Sep 24, 2015
Sold by
Galvez Lisa L and The Brad & Lisa Galvez Family
Bought by
Galvez Justin
Purchase Details
Closed on
Dec 13, 2012
Sold by
Galvez Brad Jay and Galvez Lisa Lyn
Bought by
Galvez Brad J
Purchase Details
Closed on
Nov 7, 2003
Sold by
Galvez Fred and Galvez Gayla B
Bought by
Galvez Brad Jay
Create a Home Valuation Report for This Property
The Home Valuation Report is an in-depth analysis detailing your home's value as well as a comparison with similar homes in the area
Home Values in the Area
Average Home Value in this Area
Purchase History
| Date | Buyer | Sale Price | Title Company |
|---|---|---|---|
| Cook Mckade | -- | Utah First Title | |
| Galvez Fred | -- | None Available | |
| Galvez Justin | -- | None Available | |
| Galvez Brad J | -- | None Available | |
| Galvez Brad Jay | -- | -- |
Source: Public Records
Mortgage History
| Date | Status | Borrower | Loan Amount |
|---|---|---|---|
| Open | Cook Mckade | $293,250 |
Source: Public Records
Tax History
| Year | Tax Paid | Tax Assessment Tax Assessment Total Assessment is a certain percentage of the fair market value that is determined by local assessors to be the total taxable value of land and additions on the property. | Land | Improvement |
|---|---|---|---|---|
| 2025 | $3,784 | $275,300 | $55,000 | $220,300 |
| 2024 | $3,727 | $267,850 | $55,000 | $212,850 |
| 2023 | $3,870 | $283,250 | $40,700 | $242,550 |
| 2022 | $3,591 | $264,000 | $27,500 | $236,500 |
| 2021 | $2,898 | $347,000 | $50,000 | $297,000 |
| 2020 | $2,846 | $315,000 | $40,188 | $274,812 |
| 2019 | $2,653 | $273,600 | $33,230 | $240,370 |
| 2018 | $2,041 | $202,671 | $32,332 | $170,339 |
| 2017 | $1,990 | $184,000 | $30,490 | $153,510 |
| 2016 | $1,782 | $87,828 | $16,500 | $71,328 |
| 2015 | $1,713 | $82,209 | $16,500 | $65,709 |
| 2014 | $1,731 | $100,765 | $13,750 | $87,015 |
Source: Public Records
Map
Nearby Homes
- 3254 Quincy Ave
- 816 32nd St
- 917 Sullivan Dr
- 2138 S Monroe Blvd
- 1554 S Monroe Blvd Unit B1
- 1010 Sullivan Rd
- 895 Sullivan Rd
- 3085 Quincy Ave
- 3287 Van Buren Ave
- 2839 S Van Buren Ave Unit 8
- 848 Franklin St
- 875 Patterson St
- 3374 Eccles Ave
- 3248 S Van Buren Ave
- 755 Boughton St
- 4615 S Monroe Blvd
- 835 Franklin St
- 1119 Healy St
- 3022 Monroe Blvd
- 966 30th St
Your Personal Tour Guide
Ask me questions while you tour the home.