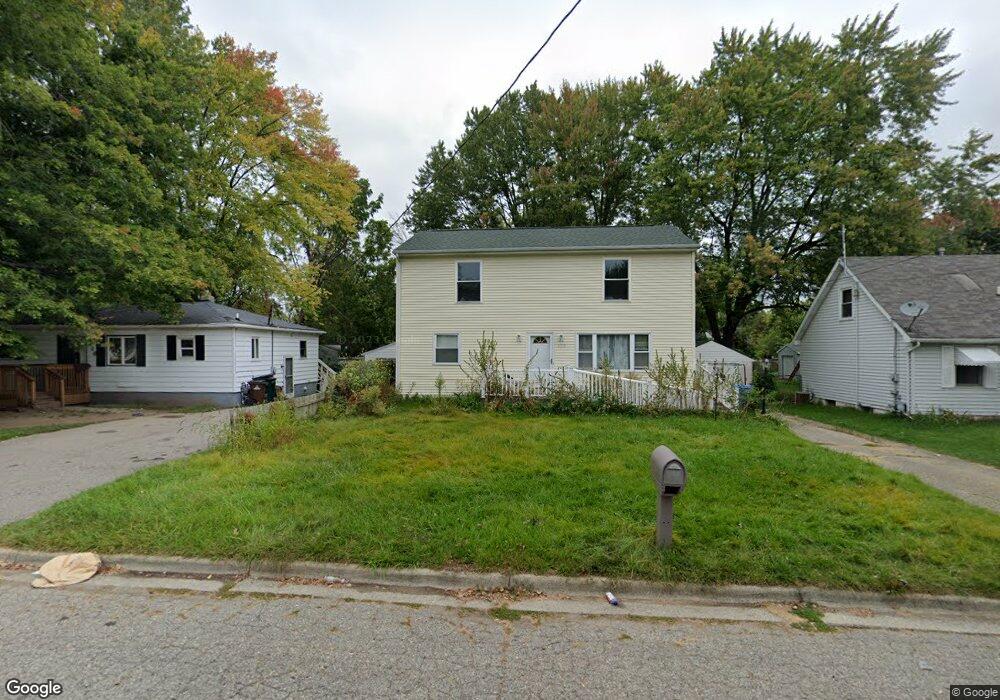
908 Hein Ave Lansing, MI 48911
South Lansing NeighborhoodEstimated Value: $167,000 - $188,000
2
Beds
1
Bath
1,728
Sq Ft
$102/Sq Ft
Est. Value
About This Home
This home is located at 908 Hein Ave, Lansing, MI 48911 and is currently estimated at $175,975, approximately $101 per square foot. 908 Hein Ave is a home located in Ingham County with nearby schools including Reo Elementary School, Attwood School, and Everett High School.
Ownership History
Date
Name
Owned For
Owner Type
Purchase Details
Closed on
Feb 25, 2013
Sold by
Trover Carrie S
Bought by
Marines Carrie
Current Estimated Value
Purchase Details
Closed on
Mar 15, 2002
Sold by
Haggerty William R
Bought by
Trover Carrie S
Home Financials for this Owner
Home Financials are based on the most recent Mortgage that was taken out on this home.
Original Mortgage
$84,630
Interest Rate
6.87%
Mortgage Type
FHA
Purchase Details
Closed on
May 20, 1999
Sold by
Hook Lawrence O and Hook Carolyn K
Bought by
Haggerty William R
Home Financials for this Owner
Home Financials are based on the most recent Mortgage that was taken out on this home.
Original Mortgage
$63,967
Interest Rate
6.94%
Mortgage Type
FHA
Create a Home Valuation Report for This Property
The Home Valuation Report is an in-depth analysis detailing your home's value as well as a comparison with similar homes in the area
Home Values in the Area
Average Home Value in this Area
Purchase History
| Date | Buyer | Sale Price | Title Company |
|---|---|---|---|
| Marines Carrie | -- | None Available | |
| Trover Carrie S | $85,300 | Midstate Title Company | |
| Haggerty William R | $64,000 | -- |
Source: Public Records
Mortgage History
| Date | Status | Borrower | Loan Amount |
|---|---|---|---|
| Previous Owner | Trover Carrie S | $84,630 | |
| Previous Owner | Haggerty William R | $63,967 |
Source: Public Records
Tax History Compared to Growth
Tax History
| Year | Tax Paid | Tax Assessment Tax Assessment Total Assessment is a certain percentage of the fair market value that is determined by local assessors to be the total taxable value of land and additions on the property. | Land | Improvement |
|---|---|---|---|---|
| 2025 | $2,837 | $89,300 | $7,600 | $81,700 |
| 2024 | $22 | $74,900 | $7,600 | $67,300 |
| 2023 | $2,661 | $65,400 | $7,600 | $57,800 |
| 2022 | $2,399 | $56,200 | $7,600 | $48,600 |
| 2021 | $2,350 | $51,600 | $5,500 | $46,100 |
| 2020 | $2,335 | $48,100 | $5,500 | $42,600 |
| 2019 | $2,238 | $45,700 | $5,500 | $40,200 |
| 2018 | $2,098 | $39,300 | $5,500 | $33,800 |
| 2017 | $2,008 | $39,300 | $5,500 | $33,800 |
| 2016 | $1,397 | $38,600 | $5,500 | $33,100 |
| 2015 | $1,397 | $24,600 | $11,023 | $13,577 |
| 2014 | $1,397 | $24,200 | $16,534 | $7,666 |
Source: Public Records
Map
Nearby Homes
- 1020 R G Curtiss Ave
- 5821 Schafer Rd
- 910 W Northrup St
- 839 Mel Ave
- 833 Mel Ave
- 6263 Marywood Ave
- 5750 Ashley Dr
- 6270 S Washington Ave
- 6037 Hughes Rd
- 5636 Ellendale Dr
- 6301 Cooper Rd
- 6029 Ellendale Dr
- 501 Bluebell Dr
- 5838 S Martin Luther King Junior Blvd
- 6444 Sommerset Rd
- 123 E Miller Rd
- 0 W Jolly Rd
- 5026 Delray Dr Unit A
- 6429 Rosedale Rd
- 4935 Delray Dr
- 916 Hein Ave
- 900 Hein Ave
- 920 Hein Ave
- 836 Hein Ave
- 913 R G Curtiss Ave
- 917 R G Curtiss Ave
- 901 R G Curtiss Ave
- 924 Hein Ave
- 923 R G Curtiss Ave
- 837 R G Curtiss Ave
- 911 Hein Ave
- 901 R G Curtiss Ave
- 828 Hein Ave
- 919 Hein Ave
- 927 R G Curtiss Ave
- 833 Hein Ave
- 930 Hein Ave
- 831 R G Curtiss Ave
- 925 Hein Ave
- 901 R G Curtis Ave