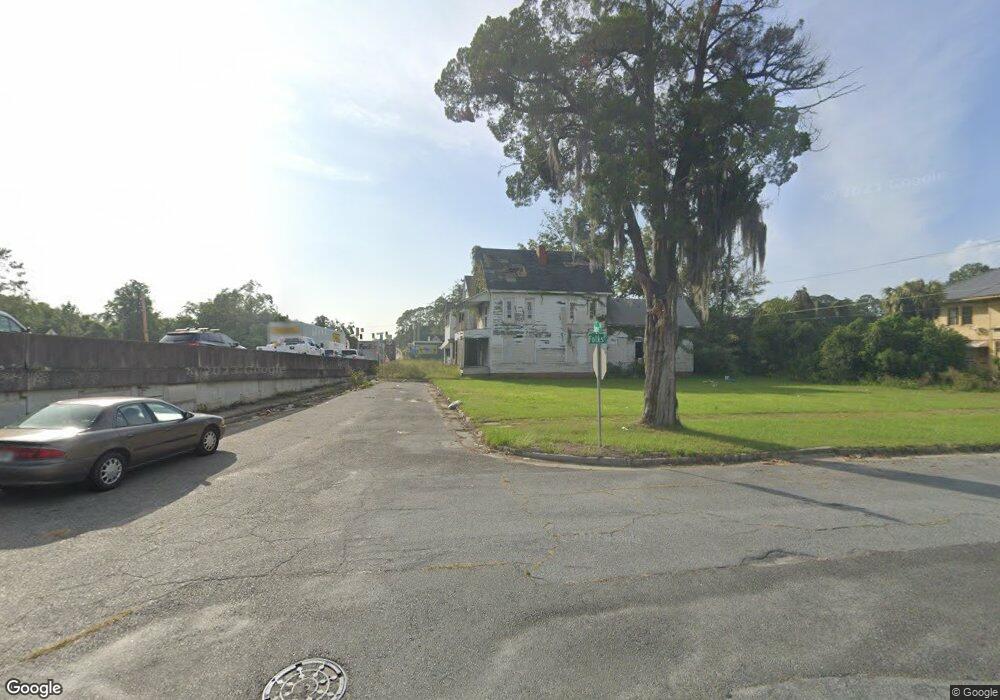
908 Jane St Waycross, GA 31501
Estimated Value: $79,000 - $110,000
4
Beds
2
Baths
2,564
Sq Ft
$37/Sq Ft
Est. Value
About This Home
This home is located at 908 Jane St, Waycross, GA 31501 and is currently estimated at $95,896, approximately $37 per square foot. 908 Jane St is a home located in Ware County with nearby schools including Waresboro Elementary School, Ware County Middle School, and Ware County High School.
Ownership History
Date
Name
Owned For
Owner Type
Purchase Details
Closed on
Jan 13, 2023
Sold by
Us Thermal Wood Llc
Bought by
Old Nine Development Llc
Current Estimated Value
Purchase Details
Closed on
Dec 28, 2022
Sold by
Walker Freeman
Bought by
Us Thermal Wood Llc
Purchase Details
Closed on
Jul 29, 2021
Sold by
Erdody Nicholas A
Bought by
Walker Freeman
Purchase Details
Closed on
Jul 15, 2019
Sold by
Lomax Kevin P
Bought by
Erdody Nicholas A
Purchase Details
Closed on
Feb 11, 2013
Sold by
United Bank
Bought by
Lomax Kevin P
Purchase Details
Closed on
Oct 4, 2002
Sold by
Waycross Properties
Bought by
United Bank As Custodian For The Ira Of
Purchase Details
Closed on
Feb 22, 2000
Sold by
Martinez Rafeal A
Bought by
Waycross Properties
Purchase Details
Closed on
Sep 29, 1999
Sold by
The Bank Of New York
Bought by
Martinez Rafeal A
Purchase Details
Closed on
Jul 14, 1999
Sold by
Terry Johnny R
Bought by
The Bank Of New York
Purchase Details
Closed on
Apr 1, 1994
Bought by
Terry Johnny R
Create a Home Valuation Report for This Property
The Home Valuation Report is an in-depth analysis detailing your home's value as well as a comparison with similar homes in the area
Home Values in the Area
Average Home Value in this Area
Purchase History
| Date | Buyer | Sale Price | Title Company |
|---|---|---|---|
| Old Nine Development Llc | -- | -- | |
| Us Thermal Wood Llc | $20,000 | -- | |
| Walker Freeman | $20,000 | -- | |
| Erdody Nicholas A | -- | -- | |
| Lomax Kevin P | $16,500 | -- | |
| United Bank As Custodian For The Ira Of | $35,500 | -- | |
| Waycross Properties | $18,500 | -- | |
| Martinez Rafeal A | $9,000 | -- | |
| The Bank Of New York | $19,600 | -- | |
| Terry Johnny R | $17,000 | -- |
Source: Public Records
Tax History Compared to Growth
Tax History
| Year | Tax Paid | Tax Assessment Tax Assessment Total Assessment is a certain percentage of the fair market value that is determined by local assessors to be the total taxable value of land and additions on the property. | Land | Improvement |
|---|---|---|---|---|
| 2024 | $863 | $23,292 | $1,036 | $22,256 |
| 2023 | $803 | $15,232 | $2,439 | $12,793 |
| 2022 | $319 | $8,000 | $1,615 | $6,385 |
| 2021 | $522 | $12,082 | $2,439 | $9,643 |
| 2020 | $519 | $11,910 | $2,439 | $9,471 |
| 2019 | $507 | $11,479 | $2,439 | $9,040 |
| 2018 | $493 | $11,049 | $2,439 | $8,610 |
| 2017 | $482 | $11,049 | $2,439 | $8,610 |
| 2016 | $482 | $11,049 | $2,439 | $8,610 |
| 2015 | $485 | $11,049 | $2,439 | $8,610 |
| 2014 | $289 | $11,049 | $2,439 | $8,610 |
| 2013 | -- | $11,049 | $2,439 | $8,610 |
Source: Public Records
Map
Nearby Homes
- 803 Elizabeth St
- 503 N Nicholls St
- 506 McDonald St
- 505 N Nicholls St
- 1103 Ann St
- 1003 Carswell Ave
- 516 Folks St
- 601 N Nicholls St
- 1208 Margaret St
- 1125 Georgia St
- 605 Walker St
- 1006 Roosevelt St
- 629 Remshart St
- 1401 Carswell Ave
- 00 Roosevelt St
- 805 Brunel St
- 1322 Jane St
- 705 Gilmore St
- 0 S Georgia Pkwy W
- 418 Reed St