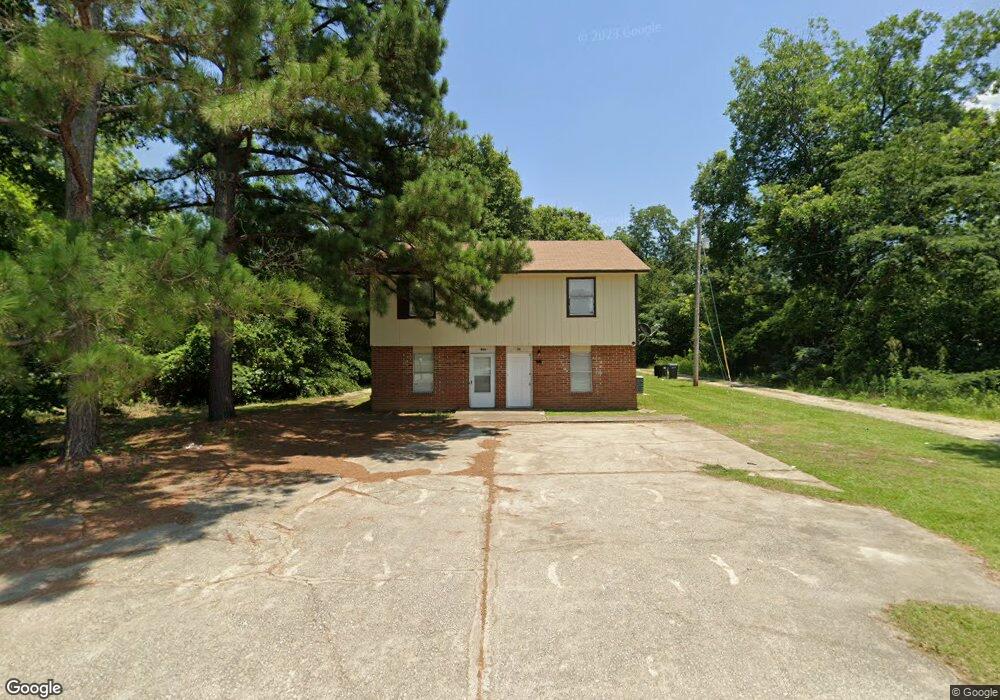
908 N 11th St Cordele, GA 31015
Estimated Value: $106,000 - $161,000
4
Beds
2
Baths
2,436
Sq Ft
$56/Sq Ft
Est. Value
About This Home
This home is located at 908 N 11th St, Cordele, GA 31015 and is currently estimated at $135,667, approximately $55 per square foot. 908 N 11th St is a home with nearby schools including Crisp County Elementary School, Crisp County Primary School, and Crisp County Middle School.
Ownership History
Date
Name
Owned For
Owner Type
Purchase Details
Closed on
Jul 29, 2003
Sold by
Maddox James A
Bought by
Daniels & Daniels Properties Inc
Current Estimated Value
Purchase Details
Closed on
Sep 8, 1999
Sold by
Daniels Daniels and Daniels Daniels
Bought by
Maddox James A
Purchase Details
Closed on
Mar 11, 1999
Sold by
Daniels Eddie
Bought by
Daniels Daniels and Daniels Daniels
Purchase Details
Closed on
Jun 18, 1993
Sold by
Sec Housing & Urban
Bought by
Daniels Eddie
Purchase Details
Closed on
Mar 3, 1992
Sold by
Rainey Thomas P
Bought by
Sec Housing & Urban
Purchase Details
Closed on
Nov 26, 1985
Sold by
Pace Earl K
Bought by
Rainey Thomas P
Create a Home Valuation Report for This Property
The Home Valuation Report is an in-depth analysis detailing your home's value as well as a comparison with similar homes in the area
Home Values in the Area
Average Home Value in this Area
Purchase History
| Date | Buyer | Sale Price | Title Company |
|---|---|---|---|
| Daniels & Daniels Properties Inc | -- | -- | |
| Maddox James A | $75,000 | -- | |
| Daniels Daniels | -- | -- | |
| Daniels Eddie | $32,000 | -- | |
| Sec Housing & Urban | -- | -- | |
| Rainey Thomas P | $51,200 | -- |
Source: Public Records
Tax History Compared to Growth
Tax History
| Year | Tax Paid | Tax Assessment Tax Assessment Total Assessment is a certain percentage of the fair market value that is determined by local assessors to be the total taxable value of land and additions on the property. | Land | Improvement |
|---|---|---|---|---|
| 2025 | $1,385 | $42,996 | $1,250 | $41,746 |
| 2024 | $1,385 | $38,646 | $1,250 | $37,396 |
| 2023 | $1,367 | $36,472 | $1,250 | $35,222 |
| 2022 | $907 | $34,297 | $1,250 | $33,047 |
| 2021 | $888 | $32,122 | $1,250 | $30,872 |
| 2020 | $904 | $32,122 | $1,250 | $30,872 |
| 2019 | $911 | $32,122 | $1,250 | $30,872 |
| 2018 | $991 | $33,628 | $1,750 | $31,878 |
| 2017 | $1,366 | $33,628 | $1,750 | $31,878 |
| 2016 | $994 | $33,628 | $1,750 | $31,878 |
| 2015 | -- | $33,628 | $1,750 | $31,878 |
| 2014 | -- | $33,628 | $1,750 | $31,878 |
| 2013 | -- | $33,627 | $1,750 | $31,877 |
Source: Public Records
Map
Nearby Homes