Estimated Value: $217,732 - $237,000
--
Bed
2
Baths
1,411
Sq Ft
$160/Sq Ft
Est. Value
About This Home
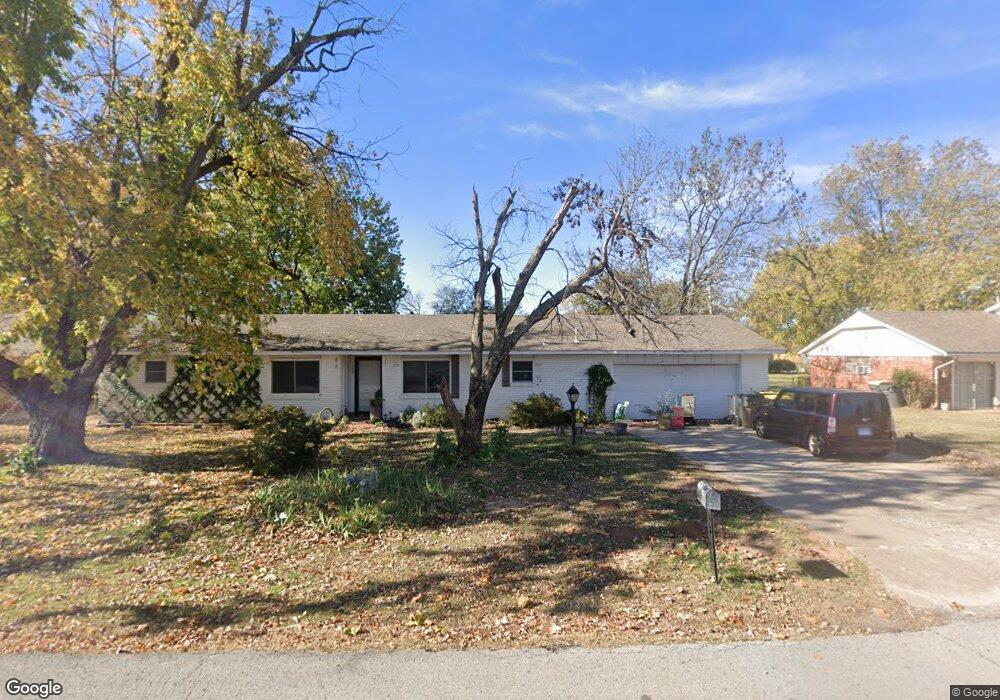
This home is located at 908 N Birch St, Jenks, OK 74037 and is currently estimated at $226,183, approximately $160 per square foot. 908 N Birch St is a home located in Tulsa County with nearby schools including Jenks West Elementary School, Jenks Middle School, and Jenks West Intermediate Elementary School.
Ownership History
Date
Name
Owned For
Owner Type
Purchase Details
Closed on
Dec 13, 2004
Sold by
Smith Todd S and Smith Pam S
Bought by
Smith Pam S
Current Estimated Value
Home Financials for this Owner
Home Financials are based on the most recent Mortgage that was taken out on this home.
Original Mortgage
$106,000
Outstanding Balance
$60,437
Interest Rate
7.87%
Mortgage Type
Stand Alone Refi Refinance Of Original Loan
Estimated Equity
$165,746
Purchase Details
Closed on
Jun 5, 2001
Sold by
Martens Ernie D and Martens Judy L
Bought by
Smith Todd S and Smith Pam S
Home Financials for this Owner
Home Financials are based on the most recent Mortgage that was taken out on this home.
Original Mortgage
$100,891
Interest Rate
7.1%
Mortgage Type
FHA
Purchase Details
Closed on
Sep 1, 1992
Purchase Details
Closed on
Sep 1, 1987
Create a Home Valuation Report for This Property
The Home Valuation Report is an in-depth analysis detailing your home's value as well as a comparison with similar homes in the area
Home Values in the Area
Average Home Value in this Area
Purchase History
| Date | Buyer | Sale Price | Title Company |
|---|---|---|---|
| Smith Pam S | -- | Nations Title | |
| Smith Todd S | $102,500 | First Tulsa Title Co | |
| -- | $67,000 | -- | |
| -- | $64,000 | -- |
Source: Public Records
Mortgage History
| Date | Status | Borrower | Loan Amount |
|---|---|---|---|
| Open | Smith Pam S | $106,000 | |
| Closed | Smith Todd S | $100,891 |
Source: Public Records
Tax History Compared to Growth
Tax History
| Year | Tax Paid | Tax Assessment Tax Assessment Total Assessment is a certain percentage of the fair market value that is determined by local assessors to be the total taxable value of land and additions on the property. | Land | Improvement |
|---|---|---|---|---|
| 2024 | $1,674 | $13,573 | $1,786 | $11,787 |
| 2023 | $1,674 | $14,148 | $1,814 | $12,334 |
| 2022 | $1,637 | $12,737 | $2,627 | $10,110 |
| 2021 | $1,607 | $12,337 | $2,544 | $9,793 |
| 2020 | $1,571 | $12,337 | $2,544 | $9,793 |
| 2019 | $1,566 | $12,210 | $2,518 | $9,692 |
| 2018 | $1,527 | $11,826 | $2,245 | $9,581 |
| 2017 | $1,454 | $12,452 | $2,364 | $10,088 |
| 2016 | $1,443 | $12,089 | $2,376 | $9,713 |
| 2015 | $1,470 | $12,089 | $2,376 | $9,713 |
| 2014 | $1,503 | $12,089 | $2,376 | $9,713 |
Source: Public Records
Map
Nearby Homes
- 108 W K Place
- 138 W M St
- 1012 N Forest Place
- 422 N Forest St
- 504 E B St Unit G
- 0 W 101st Place S
- 649 W 101st Place S
- 0 Aquarium Dr
- 9340 S Elwood Ave
- 9402 S Elwood
- 2102 W F Ct
- 2105 W F Ct
- 9031 S Delaware Ave Unit 703
- 9019 S Delaware Ave Unit 507
- 13099 S Harvard
- 9031 S Delaware Place Unit 704
- 9009 S Delaware Ave Unit 403
- 2841 E 90th St Unit 21
- 8710 S Delaware Place
- 8745 S Delaware Place