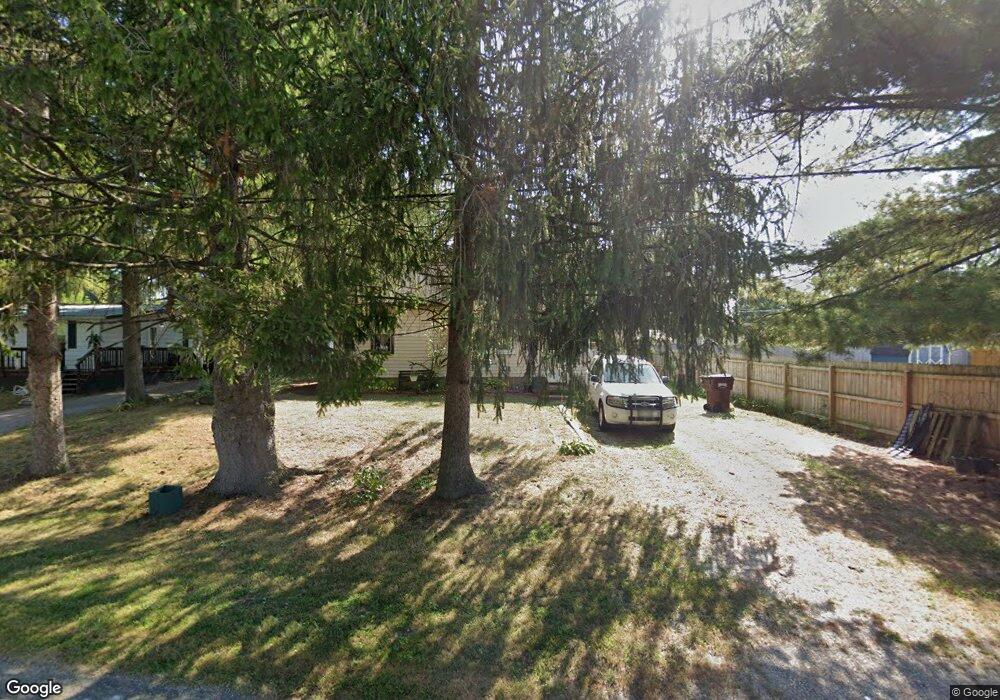
908 N Romulus St Baltimore, OH 43105
Estimated Value: $189,561 - $249,000
3
Beds
1
Bath
1,046
Sq Ft
$210/Sq Ft
Est. Value
About This Home
This home is located at 908 N Romulus St, Baltimore, OH 43105 and is currently estimated at $219,390, approximately $209 per square foot. 908 N Romulus St is a home located in Fairfield County with nearby schools including Liberty Union Elementary School, Liberty Union Middle School, and Liberty Union High School.
Ownership History
Date
Name
Owned For
Owner Type
Purchase Details
Closed on
Sep 13, 2006
Sold by
Kay Robert and Kay Tamara R
Bought by
Maxwell Susan G
Current Estimated Value
Home Financials for this Owner
Home Financials are based on the most recent Mortgage that was taken out on this home.
Original Mortgage
$94,860
Outstanding Balance
$55,876
Interest Rate
6.7%
Mortgage Type
Purchase Money Mortgage
Estimated Equity
$163,514
Purchase Details
Closed on
Mar 31, 2005
Sold by
The Bank Of New York
Bought by
Kay Robert
Home Financials for this Owner
Home Financials are based on the most recent Mortgage that was taken out on this home.
Original Mortgage
$11,000
Interest Rate
5.88%
Mortgage Type
Stand Alone Second
Purchase Details
Closed on
Apr 2, 2004
Sold by
Soper Diana L and Case #03 Cv 256
Bought by
The Bank Of New York and Eqcc Trust 2001-1F
Home Financials for this Owner
Home Financials are based on the most recent Mortgage that was taken out on this home.
Original Mortgage
$41,250
Interest Rate
6.82%
Mortgage Type
Purchase Money Mortgage
Create a Home Valuation Report for This Property
The Home Valuation Report is an in-depth analysis detailing your home's value as well as a comparison with similar homes in the area
Home Values in the Area
Average Home Value in this Area
Purchase History
| Date | Buyer | Sale Price | Title Company |
|---|---|---|---|
| Maxwell Susan G | $93,000 | None Available | |
| Kay Robert | $55,000 | Accutitle Agency Inc | |
| The Bank Of New York | $50,000 | Accutitle Agency Inc |
Source: Public Records
Mortgage History
| Date | Status | Borrower | Loan Amount |
|---|---|---|---|
| Open | Maxwell Susan G | $94,860 | |
| Previous Owner | Kay Robert | $11,000 | |
| Previous Owner | The Bank Of New York | $41,250 |
Source: Public Records
Tax History
| Year | Tax Paid | Tax Assessment Tax Assessment Total Assessment is a certain percentage of the fair market value that is determined by local assessors to be the total taxable value of land and additions on the property. | Land | Improvement |
|---|---|---|---|---|
| 2025 | $3,594 | $63,920 | $16,470 | $47,450 |
| 2024 | $3,594 | $47,880 | $11,960 | $35,920 |
| 2023 | $1,485 | $47,880 | $11,960 | $35,920 |
| 2022 | $1,489 | $47,880 | $11,960 | $35,920 |
| 2021 | $1,149 | $36,140 | $10,830 | $25,310 |
| 2020 | $1,367 | $36,140 | $10,830 | $25,310 |
| 2019 | $1,577 | $36,140 | $10,830 | $25,310 |
| 2018 | $1,309 | $27,920 | $10,830 | $17,090 |
| 2017 | $1,316 | $27,510 | $10,830 | $16,680 |
| 2016 | $1,297 | $27,510 | $10,830 | $16,680 |
| 2015 | $1,205 | $26,760 | $10,830 | $15,930 |
| 2014 | $1,156 | $26,760 | $10,830 | $15,930 |
| 2013 | $1,156 | $26,760 | $10,830 | $15,930 |
Source: Public Records
Map
Nearby Homes
- 220 N Wagner Ave
- 407 S Main St
- 403 S Walnut St
- 727 W Washington St
- 0 Cherry Ln Unit 226008720
- 601 S Main St
- 0 Basil Rd NW Unit 226003110
- 201 N Liberty St
- 7836 Basil Rd NW
- Lot 18A S Creekview Ct
- 570 Baltimore Somerset Rd NE Unit Lot 1
- 1455 Giesy Rd NW
- 445 Baltimore Somerset Rd NE
- 9915 Lancaster-Newark Rd NE
- 2200 Leonard Rd NW
- 1577 Winding Oak Dr NW
- 7947 Cherry St
- 5870 Brook Rd NW
- 5505 Tschopp Rd NE
- 12345 Cherry Ln
- 912 N Romulus St
- 900 N Romulus St
- 916 N Romulus St
- 216 E North St
- 220 E North St
- 920 N Romulus St
- 222 E North St
- 924 N Romulus St
- 909 N Romulus St
- 224 E North St
- 201 E North St
- 928 N Romulus St
- 932 N Romulus St
- 219 E North St
- 119 E North St
- 301 E North St
- 802 N Romulus St
- 936 N Romulus St
- 116 E North St
- 220 E Huntwork St
Your Personal Tour Guide
Ask me questions while you tour the home.