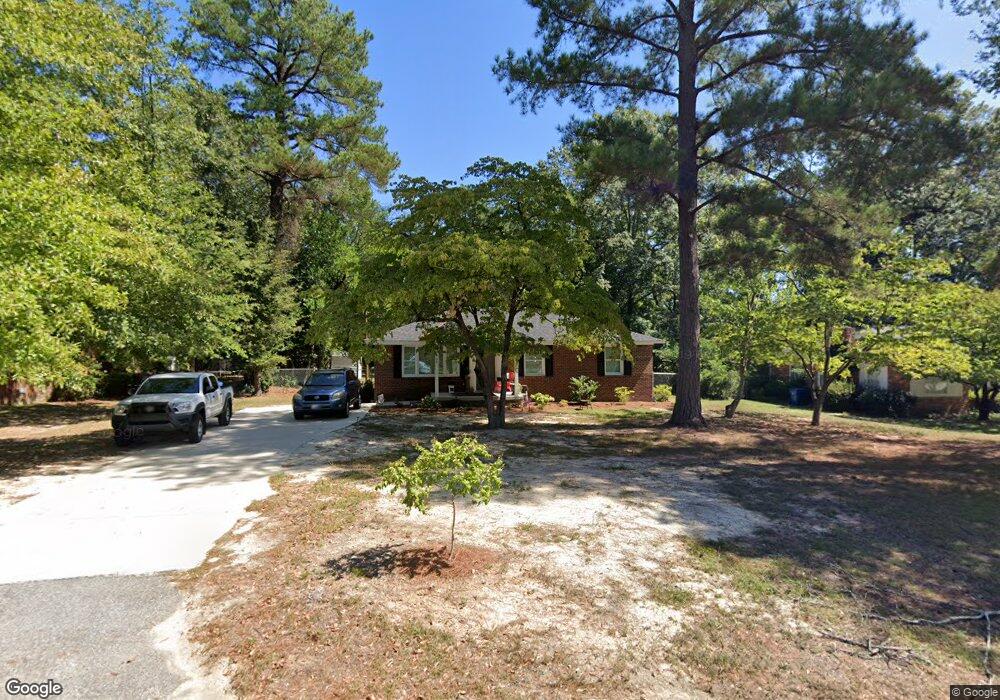
908 Osage Ave West Columbia, SC 29169
Estimated Value: $215,000 - $274,000
3
Beds
1
Bath
1,852
Sq Ft
$135/Sq Ft
Est. Value
About This Home
This home is located at 908 Osage Ave, West Columbia, SC 29169 and is currently estimated at $250,711, approximately $135 per square foot. 908 Osage Ave is a home located in Lexington County with nearby schools including Saluda River Academy For The Arts, Northside Middle, and Brookland-Cayce High School.
Ownership History
Date
Name
Owned For
Owner Type
Purchase Details
Closed on
Sep 10, 2019
Sold by
Brassell Pamela Jean and Layton Pamela Jean
Bought by
Brassell Pamela Jean and Layton Grady Alexander
Current Estimated Value
Purchase Details
Closed on
Nov 16, 2017
Sold by
Locklear Pamela B
Bought by
Brassell Pamela Jean
Home Financials for this Owner
Home Financials are based on the most recent Mortgage that was taken out on this home.
Original Mortgage
$99,200
Outstanding Balance
$82,882
Interest Rate
3.83%
Mortgage Type
New Conventional
Estimated Equity
$167,829
Purchase Details
Closed on
Oct 20, 2017
Sold by
Miles Ted D
Bought by
Locklear Pamela B
Home Financials for this Owner
Home Financials are based on the most recent Mortgage that was taken out on this home.
Original Mortgage
$99,200
Outstanding Balance
$82,882
Interest Rate
3.83%
Mortgage Type
New Conventional
Estimated Equity
$167,829
Purchase Details
Closed on
Jan 3, 2017
Sold by
Mckinley Norma L
Bought by
Miles Ted D
Create a Home Valuation Report for This Property
The Home Valuation Report is an in-depth analysis detailing your home's value as well as a comparison with similar homes in the area
Home Values in the Area
Average Home Value in this Area
Purchase History
| Date | Buyer | Sale Price | Title Company |
|---|---|---|---|
| Brassell Pamela Jean | -- | None Available | |
| Brassell Pamela Jean | $303,000 | None Available | |
| Locklear Pamela B | $124,000 | None Available | |
| Miles Ted D | -- | None Available |
Source: Public Records
Mortgage History
| Date | Status | Borrower | Loan Amount |
|---|---|---|---|
| Open | Locklear Pamela B | $99,200 |
Source: Public Records
Tax History Compared to Growth
Tax History
| Year | Tax Paid | Tax Assessment Tax Assessment Total Assessment is a certain percentage of the fair market value that is determined by local assessors to be the total taxable value of land and additions on the property. | Land | Improvement |
|---|---|---|---|---|
| 2024 | $666 | $6,215 | $1,400 | $4,815 |
| 2023 | $688 | $5,033 | $1,400 | $3,633 |
| 2022 | $451 | $5,033 | $1,400 | $3,633 |
| 2020 | $451 | $5,033 | $1,400 | $3,633 |
| 2019 | $450 | $4,960 | $1,400 | $3,560 |
| 2018 | $948 | $4,960 | $1,400 | $3,560 |
| 2017 | $682 | $5,578 | $2,100 | $3,478 |
| 2016 | $1,968 | $5,577 | $2,100 | $3,477 |
| 2015 | $125 | $5,577 | $2,100 | $3,477 |
| 2014 | $125 | $3,559 | $1,400 | $2,159 |
| 2013 | -- | $3,560 | $1,400 | $2,160 |
Source: Public Records
Map
Nearby Homes
- 816 Fontanna Ave
- 1100 Seminole Dr
- 916 Mohegan Trail
- 929-931 Central Dr
- 941 Mohegan Trail
- 1344 Gilmore St
- 638 Carrington Dr
- 918 N Lucas St
- 633 Edgewater Ln
- 634 Edgewater Ln
- 225 Edgewater Ln
- 121 Edgewater Ln
- 502A Koon St
- 318 Skipperling Ln
- 103 Chicorana Rd
- 3 Lynnwood Rd
- 100 Double Branch Ct
- 1715 Gilvie Ave
- 617 Holland Cir
- 1075 Laurel Crest Dr