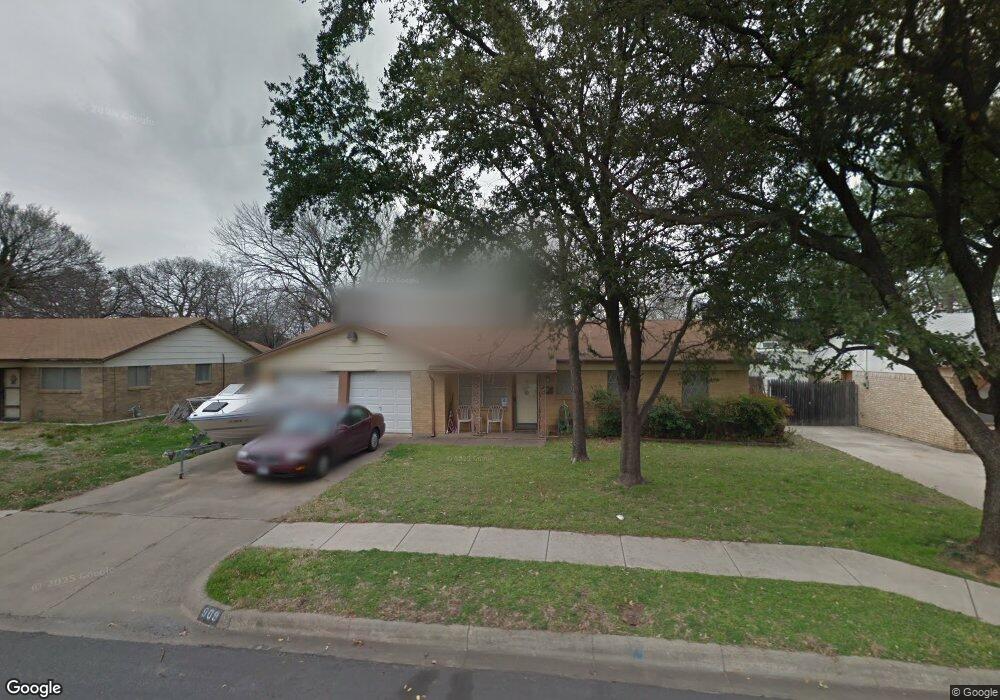
908 Russell Ln Bedford, TX 76022
Estimated Value: $235,000 - $274,000
3
Beds
2
Baths
1,254
Sq Ft
$207/Sq Ft
Est. Value
About This Home
This home is located at 908 Russell Ln, Bedford, TX 76022 and is currently estimated at $259,161, approximately $206 per square foot. 908 Russell Ln is a home located in Tarrant County with nearby schools including Stonegate Elementary School, Central J High School, and L.D. Bell High School.
Ownership History
Date
Name
Owned For
Owner Type
Purchase Details
Closed on
Apr 18, 2016
Sold by
Killian Richard S
Bought by
St Josephs Rentals Llc
Current Estimated Value
Purchase Details
Closed on
Jul 31, 2013
Sold by
Sturkie Matt
Bought by
Killian Richard S
Home Financials for this Owner
Home Financials are based on the most recent Mortgage that was taken out on this home.
Original Mortgage
$62,625
Interest Rate
3.93%
Mortgage Type
New Conventional
Purchase Details
Closed on
Jun 27, 2013
Sold by
Tomison Charles Edward and Tomison Robert Lee
Bought by
Sturkie Matt
Home Financials for this Owner
Home Financials are based on the most recent Mortgage that was taken out on this home.
Original Mortgage
$62,625
Interest Rate
3.93%
Mortgage Type
New Conventional
Purchase Details
Closed on
Mar 23, 2010
Sold by
Tomison Robert Lee and Tomison Charles Edward
Bought by
Tomison Robert Lee and Tomison Charles Edward
Create a Home Valuation Report for This Property
The Home Valuation Report is an in-depth analysis detailing your home's value as well as a comparison with similar homes in the area
Home Values in the Area
Average Home Value in this Area
Purchase History
| Date | Buyer | Sale Price | Title Company |
|---|---|---|---|
| St Josephs Rentals Llc | -- | None Available | |
| Killian Richard S | -- | None Available | |
| Sturkie Matt | -- | None Available | |
| Tomison Robert Lee | -- | None Available |
Source: Public Records
Mortgage History
| Date | Status | Borrower | Loan Amount |
|---|---|---|---|
| Previous Owner | Killian Richard S | $62,625 | |
| Previous Owner | Sturkie Matt | $70,000 |
Source: Public Records
Tax History Compared to Growth
Tax History
| Year | Tax Paid | Tax Assessment Tax Assessment Total Assessment is a certain percentage of the fair market value that is determined by local assessors to be the total taxable value of land and additions on the property. | Land | Improvement |
|---|---|---|---|---|
| 2025 | $3,668 | $167,000 | $60,000 | $107,000 |
| 2024 | $3,668 | $188,414 | $60,000 | $128,414 |
| 2023 | $3,263 | $170,142 | $45,000 | $125,142 |
| 2022 | $3,671 | $168,071 | $45,000 | $123,071 |
| 2021 | $3,298 | $140,000 | $45,000 | $95,000 |
| 2020 | $3,329 | $140,000 | $45,000 | $95,000 |
| 2019 | $3,401 | $140,000 | $45,000 | $95,000 |
| 2018 | $3,280 | $135,000 | $18,000 | $117,000 |
| 2017 | $2,895 | $119,691 | $18,000 | $101,691 |
| 2016 | $2,429 | $100,412 | $18,000 | $82,412 |
| 2015 | $2,135 | $85,000 | $18,000 | $67,000 |
| 2014 | $2,135 | $88,600 | $18,000 | $70,600 |
Source: Public Records
Map
Nearby Homes
- 1008 Russell Ln
- 344 Bedford Ct E
- 501 Merrill Dr
- 1112 Ann St
- 341 Hurst Dr
- 1236 King Dr
- 849 Russell Ln
- 1108 Wade Dr
- 933 Wade Dr
- 604 Donna Ln
- 905 Brown Trail
- 49 Coffee Tavern Rd
- 803 Glenda Dr
- 802 Brown Trail
- 832 Chateau Valee Cir
- 1213 Briar Dr
- 1204 Edgecliff Dr
- 1220 Norwood Dr
- 1136 Simpson Dr
- 921 Overhill Dr