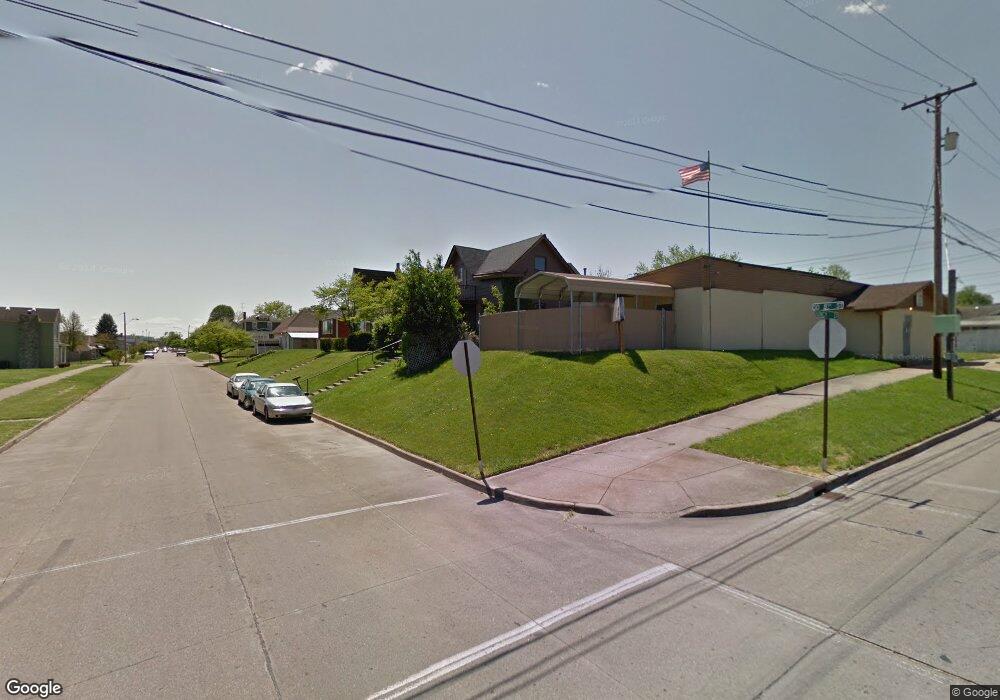
908 S 8th St Unit BO-2 Ironton, OH 45638
Estimated Value: $82,000 - $247,000
3
Beds
1
Bath
1,305
Sq Ft
$112/Sq Ft
Est. Value
About This Home
This home is located at 908 S 8th St Unit BO-2, Ironton, OH 45638 and is currently estimated at $146,407, approximately $112 per square foot. 908 S 8th St Unit BO-2 is a home located in Lawrence County with nearby schools including Ironton Elementary School, Ironton Middle School, and Ironton High School.
Ownership History
Date
Name
Owned For
Owner Type
Purchase Details
Closed on
Jun 13, 2025
Sold by
Koukos Hunter and Anson Andrea
Bought by
Seagraves Noel
Current Estimated Value
Purchase Details
Closed on
Sep 2, 2024
Sold by
Anson Andrea and Koukos Hunter
Bought by
Seagraves Noel
Purchase Details
Closed on
May 16, 2023
Sold by
Castle 2020 Llc
Bought by
Koukos Hunter and Anson Andrea
Purchase Details
Closed on
Aug 30, 2022
Sold by
Vrmtg Asset Trust
Bought by
Castle 2020 Llc
Purchase Details
Closed on
Oct 18, 2021
Sold by
Carter William and Jp Morgan Mortgage Acquisition
Bought by
Us Bank Trust National Association and Vrmtg Asset Trust
Purchase Details
Closed on
Jan 28, 1991
Sold by
Carter William R and Carter June
Bought by
Carter William R and Carter June
Create a Home Valuation Report for This Property
The Home Valuation Report is an in-depth analysis detailing your home's value as well as a comparison with similar homes in the area
Home Values in the Area
Average Home Value in this Area
Purchase History
| Date | Buyer | Sale Price | Title Company |
|---|---|---|---|
| Seagraves Noel | $17,000 | None Listed On Document | |
| Seagraves Noel | $17,000 | None Listed On Document | |
| Seagraves Noel | $17,000 | None Listed On Document | |
| Seagraves Noel | $17,000 | None Listed On Document | |
| Koukos Hunter | $12,000 | None Listed On Document | |
| Castle 2020 Llc | $16,500 | -- | |
| Castle 2020 Llc | $16,500 | None Listed On Document | |
| Us Bank Trust National Association | $31,075 | None Available | |
| Carter William R | -- | -- |
Source: Public Records
Tax History Compared to Growth
Tax History
| Year | Tax Paid | Tax Assessment Tax Assessment Total Assessment is a certain percentage of the fair market value that is determined by local assessors to be the total taxable value of land and additions on the property. | Land | Improvement |
|---|---|---|---|---|
| 2024 | -- | $20,130 | $2,660 | $17,470 |
| 2023 | $752 | $20,130 | $2,660 | $17,470 |
| 2022 | $751 | $20,130 | $2,660 | $17,470 |
| 2021 | $313 | $17,080 | $2,260 | $14,820 |
| 2020 | $329 | $17,080 | $2,260 | $14,820 |
| 2019 | $328 | $17,080 | $2,260 | $14,820 |
| 2018 | $331 | $17,080 | $2,260 | $14,820 |
| 2017 | $331 | $17,080 | $2,260 | $14,820 |
| 2016 | $308 | $17,080 | $2,260 | $14,820 |
| 2015 | $287 | $16,230 | $2,490 | $13,740 |
| 2014 | $278 | $16,230 | $2,490 | $13,740 |
| 2013 | $277 | $16,230 | $2,490 | $13,740 |
Source: Public Records
Map
Nearby Homes
- 721 Chestnut St
- 721 Chestnut St Unit CO-1
- 717 Chestnut St Unit IO-1
- 914 S 8th St Unit IO-2
- 1014 S 5th St
- 1016 S 5th St
- 817 S 4th St
- 517 Spruce St
- 1214 S 5th St
- 1214 S 5th St Unit 1216, 1216 1/2 S 5th
- 516 S 7th St
- 1324 S 10th St
- 605 S 10th St
- 520 S 10th St
- 914 Pine St
- 914 Pine St
- 1216 S 4th St
- 506 S 10th St
- 311 Spruce St
- 1219 Penobscot Trail
- 908 S 8th St
- 908 S 8th St Unit AO-1
- 908 S 8th St Unit CO-1
- 910 S 8th St
- 914 S 8th St
- 918 S 8th St
- 918 S 8th St Unit JO-6
- 905 S 8th St
- 913 S 8th St
- 917 S 8th St
- 717 Quincy St
- 901 S 7th St
- 717 Chestnut St
- 721 Chestnut St Unit EO-1
- 903 S 7th St
- 818 S 8th St
- 715 Quincy St
- 915 S 7th St
- 919 S 7th St
- 923 S 8th St