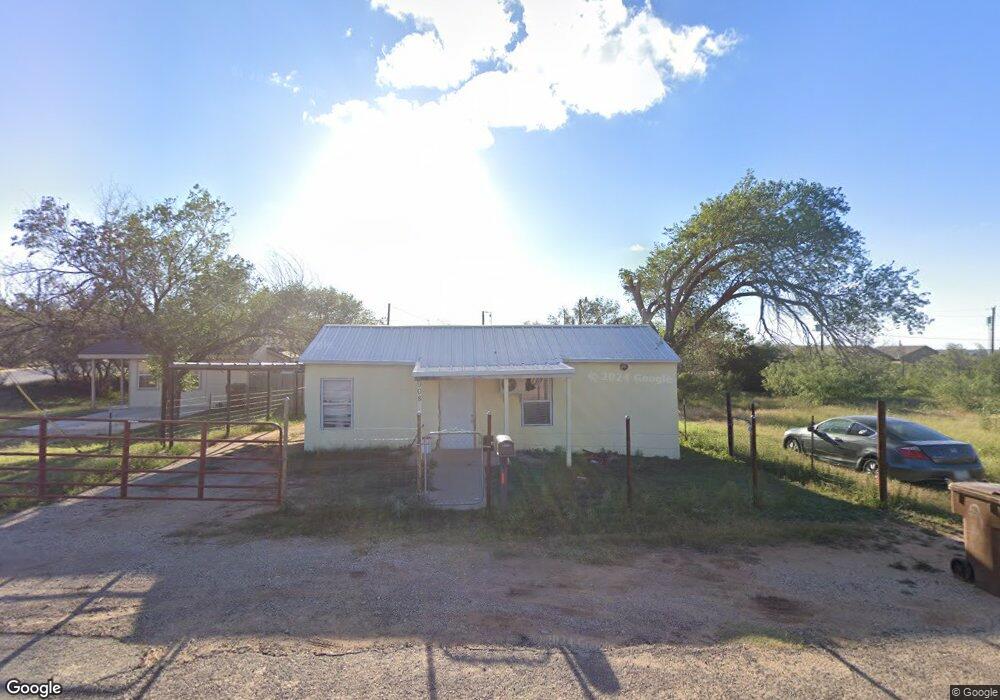
908 S Bell St Big Spring, TX 79720
Estimated Value: $55,247 - $118,000
--
Bed
--
Bath
1,097
Sq Ft
$83/Sq Ft
Est. Value
About This Home
This home is located at 908 S Bell St, Big Spring, TX 79720 and is currently estimated at $91,312, approximately $83 per square foot. 908 S Bell St is a home located in Howard County with nearby schools including Big Spring High School, St. Mary's Episcopal School, and Nazarene Christian Academy Big Spring.
Ownership History
Date
Name
Owned For
Owner Type
Purchase Details
Closed on
Aug 1, 2023
Sold by
Zavala Marissa and Zavala Adriela
Bought by
Herrera Esmeralda and Gardea Escobedo Salvador
Current Estimated Value
Purchase Details
Closed on
Jun 9, 2021
Sold by
Esmerelda Herrera
Bought by
Mesta Ishmel and Valerio Rebeca
Purchase Details
Closed on
Mar 5, 2013
Sold by
Gonzalez Maria Ramirez
Bought by
Zavala Antonio and Zavala Maria
Purchase Details
Closed on
Oct 14, 2008
Sold by
Lopez Richard
Bought by
Gonzalez Maria Ramirez
Purchase Details
Closed on
Aug 10, 2006
Sold by
Lopez Celia Torres
Bought by
Lopez Richard
Purchase Details
Closed on
Jul 7, 2005
Sold by
Martinez Teddie P and Martin Teddie Paul
Bought by
Lopez Celia Torres
Purchase Details
Closed on
Jan 14, 2005
Sold by
Garcia Maria and Garcia Cecil
Bought by
Martinez Teddie P
Purchase Details
Closed on
Jun 12, 2003
Sold by
Gregory William A
Bought by
Garcia Maria
Create a Home Valuation Report for This Property
The Home Valuation Report is an in-depth analysis detailing your home's value as well as a comparison with similar homes in the area
Home Values in the Area
Average Home Value in this Area
Purchase History
| Date | Buyer | Sale Price | Title Company |
|---|---|---|---|
| Herrera Esmeralda | -- | Lawyers Title Insurance | |
| Mesta Ishmel | -- | Joshua Hamby Pc | |
| Zavala Antonio | -- | None Available | |
| Gonzalez Maria Ramirez | -- | None Available | |
| Lopez Richard | -- | None Available | |
| Lopez Celia Torres | -- | None Available | |
| Martinez Teddie P | -- | None Available | |
| Garcia Maria | -- | None Available |
Source: Public Records
Tax History Compared to Growth
Tax History
| Year | Tax Paid | Tax Assessment Tax Assessment Total Assessment is a certain percentage of the fair market value that is determined by local assessors to be the total taxable value of land and additions on the property. | Land | Improvement |
|---|---|---|---|---|
| 2024 | $500 | $28,116 | $5,837 | $22,279 |
| 2023 | $497 | $28,191 | $2,250 | $25,941 |
| 2022 | $478 | $23,431 | $1,800 | $21,631 |
| 2021 | $886 | $37,702 | $1,800 | $35,902 |
| 2020 | $804 | $33,797 | $1,800 | $31,997 |
| 2019 | $793 | $31,345 | $1,800 | $29,545 |
| 2018 | $958 | $31,973 | $1,800 | $30,173 |
| 2017 | $946 | $32,153 | $1,350 | $30,803 |
| 2016 | $965 | $32,782 | $1,350 | $31,432 |
| 2015 | -- | $33,408 | $1,350 | $32,058 |
| 2014 | -- | $3,657 | $675 | $2,982 |
Source: Public Records
Map
Nearby Homes
- 1204 Pennsylvania Ave
- 107 W 10th St
- 509 S Aylesford St
- 509 S Bell St
- 1305 Pennsylvania Ave
- 503 S Aylesford St
- 1308 Scurry St Unit A,B,C,D,E
- 815 W 7th St
- 803 W 14th St
- 801 W 15th St
- 0 Interstate 20
- 0 Nix Rd
- 1513 Scurry St
- 606 San Jacinto St
- 702 W 18th St
- 1405 Nolan St
- 0000 W County Rd 10
- 214 Peterson
- 1606 Johnson St
- 601 Edwards Blvd
- 500 Martin Luther King Blvd
- 906 S Bell St
- 904 S Bell St
- 902 S Bell St
- 907 S Bell St
- 510 S Martin Luther King Blvd
- 900 S Bell St
- 1100 Mlk Big Spring
- 1001 S Bell St
- 908 S Lancaster St
- 811 S Aylesford St
- 1002 S Lancaster St
- 908 S Aylesford St
- 410 Martin Luther King Blvd
- 408 Martin Luther King Blvd
- 406 Martin Luther King Blvd
- 900 S Aylesford St
- 808 N Bell St
- 1000 S Lancaster St
- 1103 Pennsylvania Ave