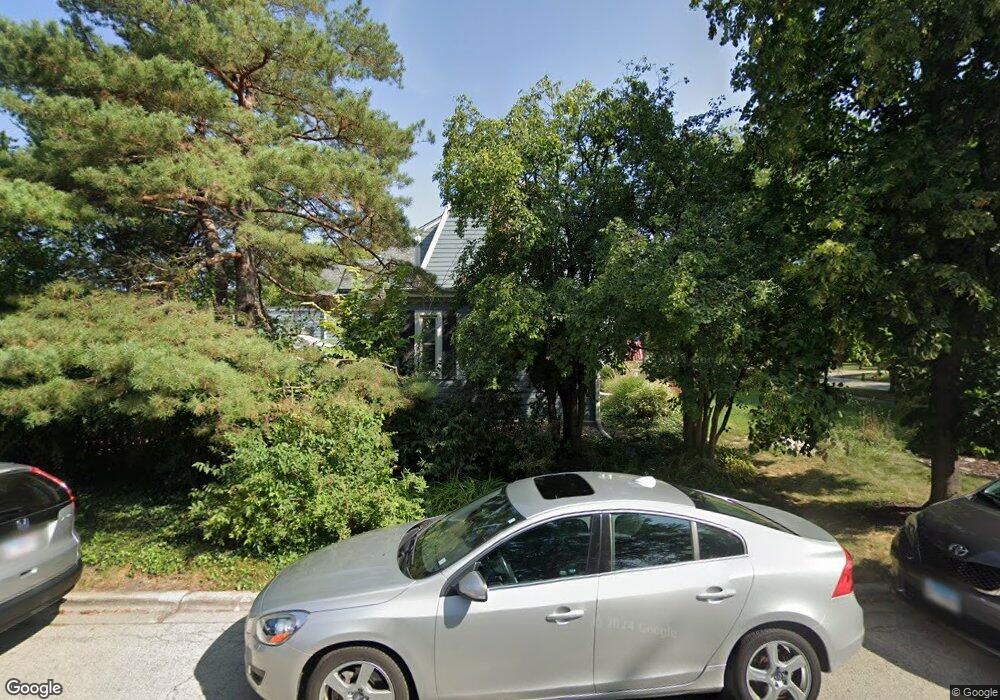
908 S Fairview Ave Park Ridge, IL 60068
Estimated Value: $649,000 - $840,000
3
Beds
3
Baths
1,963
Sq Ft
$361/Sq Ft
Est. Value
About This Home
This home is located at 908 S Fairview Ave, Park Ridge, IL 60068 and is currently estimated at $708,627, approximately $360 per square foot. 908 S Fairview Ave is a home located in Cook County with nearby schools including Theodore Roosevelt Elementary School, Lincoln Middle School, and Maine South High School.
Ownership History
Date
Name
Owned For
Owner Type
Purchase Details
Closed on
Jun 25, 2003
Sold by
Baresky John G and Baresky Laura L
Bought by
Baresky John G and Baresky Laura J
Current Estimated Value
Purchase Details
Closed on
Mar 11, 2002
Sold by
Baresky John G and Baresky Laura L
Bought by
Baresky John G and Baresky Laura L
Home Financials for this Owner
Home Financials are based on the most recent Mortgage that was taken out on this home.
Original Mortgage
$189,600
Interest Rate
6.01%
Purchase Details
Closed on
Jan 17, 2002
Sold by
Baresky John G
Bought by
Baresky John G and Baresky Laura L
Home Financials for this Owner
Home Financials are based on the most recent Mortgage that was taken out on this home.
Original Mortgage
$189,600
Interest Rate
6.01%
Purchase Details
Closed on
Jun 26, 2000
Sold by
Harbert James D and Harbert Carol A
Bought by
Baresky John G and Baresky Laura L
Home Financials for this Owner
Home Financials are based on the most recent Mortgage that was taken out on this home.
Original Mortgage
$190,000
Interest Rate
8.66%
Create a Home Valuation Report for This Property
The Home Valuation Report is an in-depth analysis detailing your home's value as well as a comparison with similar homes in the area
Home Values in the Area
Average Home Value in this Area
Purchase History
| Date | Buyer | Sale Price | Title Company |
|---|---|---|---|
| Baresky John G | -- | -- | |
| Baresky John G | -- | -- | |
| Baresky John G | -- | Midwest Land Title Co Inc | |
| Baresky John G | $415,000 | -- |
Source: Public Records
Mortgage History
| Date | Status | Borrower | Loan Amount |
|---|---|---|---|
| Previous Owner | Baresky John G | $189,600 | |
| Previous Owner | Baresky John G | $190,000 |
Source: Public Records
Tax History Compared to Growth
Tax History
| Year | Tax Paid | Tax Assessment Tax Assessment Total Assessment is a certain percentage of the fair market value that is determined by local assessors to be the total taxable value of land and additions on the property. | Land | Improvement |
|---|---|---|---|---|
| 2024 | $13,213 | $49,457 | $17,675 | $31,782 |
| 2023 | $12,633 | $52,000 | $17,675 | $34,325 |
| 2022 | $12,633 | $52,000 | $17,675 | $34,325 |
| 2021 | $12,504 | $44,444 | $10,916 | $33,528 |
| 2020 | $12,075 | $44,444 | $10,916 | $33,528 |
| 2019 | $13,391 | $54,809 | $10,916 | $43,893 |
| 2018 | $11,587 | $43,925 | $9,357 | $34,568 |
| 2017 | $11,555 | $43,925 | $9,357 | $34,568 |
| 2016 | $12,013 | $46,281 | $9,357 | $36,924 |
| 2015 | $12,064 | $41,737 | $7,797 | $33,940 |
| 2014 | $11,842 | $41,737 | $7,797 | $33,940 |
| 2013 | $11,200 | $41,737 | $7,797 | $33,940 |
Source: Public Records
Map
Nearby Homes
- 819 Albion Ave
- 820 W Talcott Rd
- 1116 S Cumberland Ave
- 1016 Arthur St
- 919 S Chester Ave
- 1015 Arthur St
- 901 S Cumberland Ave
- 1014 S Chester Ave
- 1220 Courtland Ave
- 1020 S Vine Ave
- 425 W Talcott Rd
- 428 S Clifton Ave
- 1212 S Greenwood Ave
- 718 S Washington Ave
- 316 S Fairview Ave
- 912 Harrison St
- 929 S Aldine Ave
- 249 S Vine Ave Unit B
- 1021 Cleveland Ave
- 929 Garden St
- 904 S Fairview Ave
- 842 S Fairview Ave
- 805 Albion Ave
- 920 S Fairview Ave
- 840 S Fairview Ave
- 809 Albion Ave
- 909 S Cumberland Ave
- 903 S Cumberland Ave
- 836 S Fairview Ave
- 907 S Fairview Ave
- 980 S Fairview Ave
- 903 S Fairview Ave
- 841 S Cumberland Ave
- 919 S Cumberland Ave
- 841 S Fairview Ave
- 830 S Fairview Ave
- 837 S Cumberland Ave
- 839 S Fairview Ave
- 1000 S Fairview Ave
- 925 S Cumberland Ave