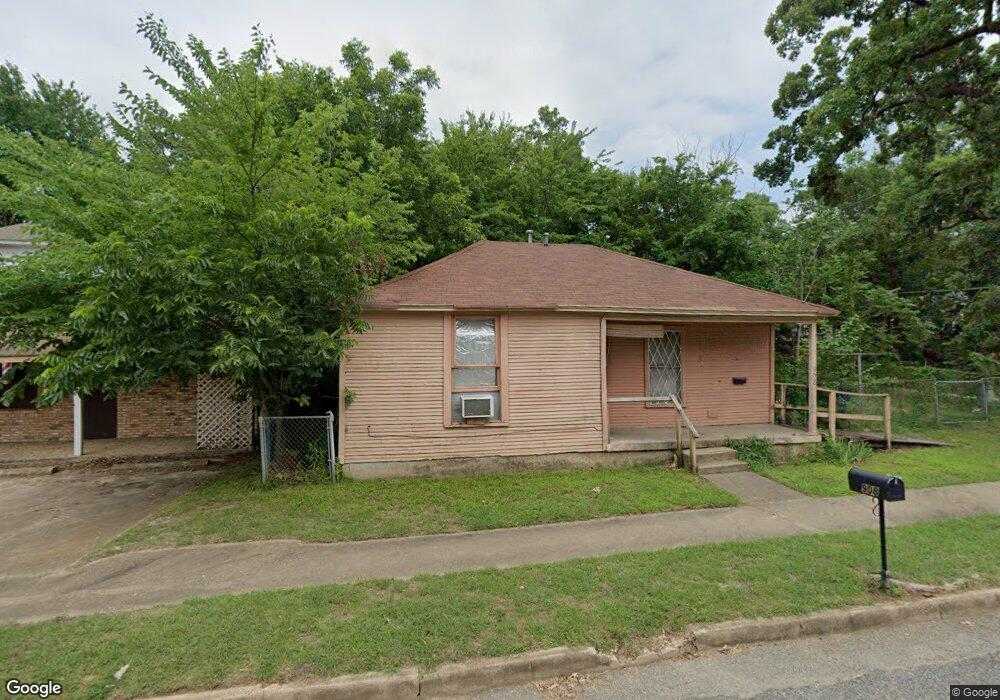
908 S Mirick Ave Denison, TX 75020
Estimated Value: $109,185 - $134,000
--
Bed
--
Bath
840
Sq Ft
$145/Sq Ft
Est. Value
About This Home
This home is located at 908 S Mirick Ave, Denison, TX 75020 and is currently estimated at $121,593, approximately $144 per square foot. 908 S Mirick Ave is a home located in Grayson County with nearby schools including Scott Middle School, Denison High School, and St. Luke's Parish Day School.
Ownership History
Date
Name
Owned For
Owner Type
Purchase Details
Closed on
Jul 21, 2023
Sold by
Davis Billy and Davis Bettye
Bought by
Davis John Mark and Davis Jacquelyn Rebecca
Current Estimated Value
Home Financials for this Owner
Home Financials are based on the most recent Mortgage that was taken out on this home.
Original Mortgage
$115,000
Outstanding Balance
$111,533
Interest Rate
5.5%
Mortgage Type
New Conventional
Estimated Equity
$10,060
Purchase Details
Closed on
Nov 1, 2006
Sold by
Mcananey James David
Bought by
Davis Billy and Davis Bettye
Create a Home Valuation Report for This Property
The Home Valuation Report is an in-depth analysis detailing your home's value as well as a comparison with similar homes in the area
Home Values in the Area
Average Home Value in this Area
Purchase History
| Date | Buyer | Sale Price | Title Company |
|---|---|---|---|
| Davis John Mark | -- | Grayson County Title | |
| Davis Billy | -- | Grayson County Title |
Source: Public Records
Mortgage History
| Date | Status | Borrower | Loan Amount |
|---|---|---|---|
| Open | Davis John Mark | $115,000 |
Source: Public Records
Tax History Compared to Growth
Tax History
| Year | Tax Paid | Tax Assessment Tax Assessment Total Assessment is a certain percentage of the fair market value that is determined by local assessors to be the total taxable value of land and additions on the property. | Land | Improvement |
|---|---|---|---|---|
| 2025 | $1,384 | $62,946 | $26,592 | $36,354 |
| 2024 | $1,384 | $59,571 | $26,592 | $32,979 |
| 2023 | $1,366 | $60,302 | $22,400 | $37,902 |
| 2022 | $1,198 | $50,422 | $21,216 | $29,206 |
| 2021 | $834 | $33,058 | $8,000 | $25,058 |
| 2020 | $769 | $29,163 | $3,648 | $25,515 |
| 2019 | $893 | $32,439 | $3,648 | $28,791 |
| 2018 | $551 | $19,848 | $2,560 | $17,288 |
| 2017 | $548 | $19,582 | $1,280 | $18,302 |
| 2016 | $487 | $17,422 | $1,152 | $16,270 |
| 2015 | $539 | $19,069 | $1,344 | $17,725 |
| 2014 | $539 | $19,069 | $1,344 | $17,725 |
Source: Public Records
Map
Nearby Homes
- 511 W Munson St
- 621 W Munson St
- 430 W Munson St
- 513 W Texas St
- 615 W Texas St
- 701 W Hull St Unit 101-2
- 704 W Hull St
- 408 W Day St
- 702 S Barrett Ave
- 708 W Texas St
- 326 W Day St
- 415 W Monterey St
- 330 W Texas St
- 1011 S Armstrong Ave
- TBD W Texas St
- 1401 W Texas St
- 0000 W Texas St
- 309 W Monterey St
- 901 W Munson St
- 1007 S Scullin Ave
- 526 W Munson St
- 526 W Munson St Unit 2
- 526 W Munson St Unit 4
- 526 W Munson St Unit 3
- 522 W Munson St
- 600 W Munson St
- 930 S Mirick Ave
- 527 W Hull St
- 520 W Munson St
- 523 W Hull St
- 606 W Munson St
- 517 W Hull St
- 919 S Mirick Ave
- 610 W Munson St
- 516 W Munson St
- 531 W Munson St
- 513 W Hull St
- 611 W Hull St
- 525 W Munson St
- 614 W Munson St