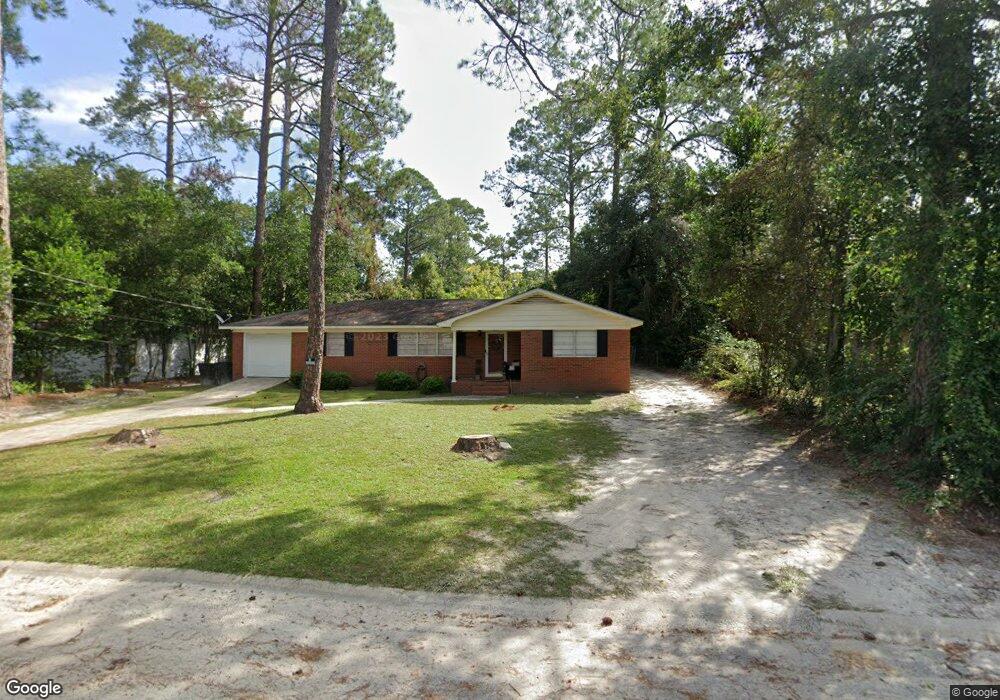
908 Saint Catherine Dr Waycross, GA 31501
Estimated Value: $153,000 - $172,000
3
Beds
2
Baths
1,560
Sq Ft
$102/Sq Ft
Est. Value
About This Home
This home is located at 908 Saint Catherine Dr, Waycross, GA 31501 and is currently estimated at $158,850, approximately $101 per square foot. 908 Saint Catherine Dr is a home located in Ware County with nearby schools including Williams Heights Elementary School, Waycross Middle School, and Ware County High School.
Ownership History
Date
Name
Owned For
Owner Type
Purchase Details
Closed on
Jan 10, 2020
Sold by
Baldwin Joi C
Bought by
Baldwin Demetrius
Current Estimated Value
Home Financials for this Owner
Home Financials are based on the most recent Mortgage that was taken out on this home.
Original Mortgage
$75,998
Outstanding Balance
$68,144
Interest Rate
4.4%
Mortgage Type
FHA
Estimated Equity
$90,706
Purchase Details
Closed on
Jan 8, 2020
Sold by
Shadron Marion M
Bought by
Baldwin Joi C
Home Financials for this Owner
Home Financials are based on the most recent Mortgage that was taken out on this home.
Original Mortgage
$75,998
Outstanding Balance
$68,144
Interest Rate
4.4%
Mortgage Type
FHA
Estimated Equity
$90,706
Purchase Details
Closed on
May 1, 1994
Bought by
Shadron Marion M and Shadron Irene
Purchase Details
Closed on
Jun 3, 1991
Bought by
Shadron Marion M and Shadron Irene
Purchase Details
Closed on
Aug 27, 1985
Create a Home Valuation Report for This Property
The Home Valuation Report is an in-depth analysis detailing your home's value as well as a comparison with similar homes in the area
Home Values in the Area
Average Home Value in this Area
Purchase History
| Date | Buyer | Sale Price | Title Company |
|---|---|---|---|
| Baldwin Demetrius | -- | -- | |
| Baldwin Joi C | $77,400 | -- | |
| Shadron Marion M | -- | -- | |
| Shadron Marion M | $48,600 | -- | |
| -- | $67,000 | -- |
Source: Public Records
Mortgage History
| Date | Status | Borrower | Loan Amount |
|---|---|---|---|
| Open | Baldwin Demetrius | $75,998 | |
| Closed | Baldwin Joi C | $75,998 |
Source: Public Records
Tax History Compared to Growth
Tax History
| Year | Tax Paid | Tax Assessment Tax Assessment Total Assessment is a certain percentage of the fair market value that is determined by local assessors to be the total taxable value of land and additions on the property. | Land | Improvement |
|---|---|---|---|---|
| 2024 | $1,268 | $51,137 | $4,960 | $46,177 |
| 2023 | $1,255 | $42,909 | $2,985 | $39,924 |
| 2022 | $1,255 | $42,909 | $2,985 | $39,924 |
| 2021 | $1,104 | $35,334 | $2,985 | $32,349 |
| 2020 | $1,141 | $33,741 | $2,985 | $30,756 |
| 2019 | $1,013 | $31,351 | $2,985 | $28,366 |
| 2018 | $1,023 | $30,355 | $2,985 | $27,370 |
| 2017 | $994 | $30,355 | $2,985 | $27,370 |
| 2016 | $994 | $30,355 | $2,985 | $27,370 |
| 2015 | $999 | $30,355 | $2,985 | $27,370 |
| 2014 | $997 | $30,355 | $2,985 | $27,370 |
| 2013 | -- | $31,941 | $2,985 | $28,956 |
Source: Public Records
Map
Nearby Homes
- 1204 Richmond Ave
- 807 City Blvd
- 1100 Atlantic Ave
- 1002 Baltimore Ave
- 1205 Dean Dr
- 1100 Euclid Ave
- 1312 Atlantic Ave
- 903 Atlantic Ave
- 1009 Euclid Ave
- 907 Euclid Ave
- 1001 Coral Rd
- 713 Magnolia Dr
- 00 Seminole Trail
- 914 Barkley St
- 0 Saint Marys Dr Unit (TRACT 2 0.25 ACRES)
- 1400 E Cherokee Dr
- 1502 Seminole Trail
- 707 Euclid Ave
- 1504 Danora Dr
- 808 Satilla Blvd
- 910 Saint Catherine Dr
- 1201 Shawnee Dr
- 1211 Shawnee Dr
- 912 Saint Catherine's Dr
- 912 Saint Catherine Dr
- 1204 Atlantic Ave
- 1206 Atlantic Ave
- 1213 Shawnee Dr
- 1200 Shawnee Dr
- 907 Saint Catherine Dr
- 907 Saint Catherine's Dr
- 1208 Atlantic Ave
- 1210 Shawnee Dr
- 1002 Saint Catherine Dr
- 1215 Shawnee Dr
- 1203 Atlantic Ave
- 808 Saint Catherine's Dr
- 808 Saint Catherine Dr
- 1212 Shawnee Dr
- 1210 Atlantic Ave