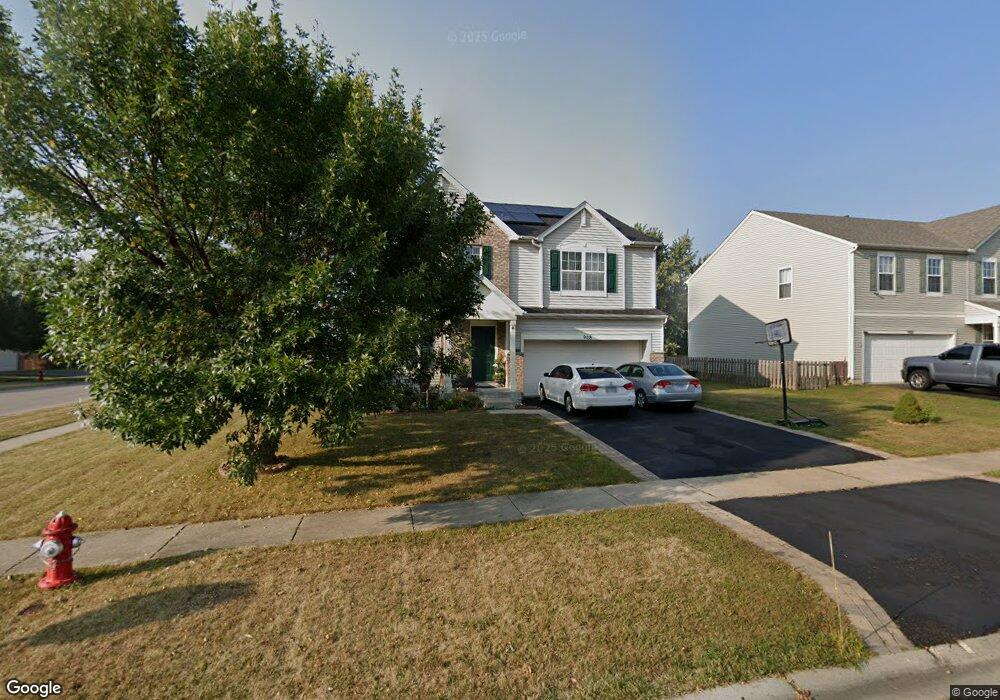
908 Seneca Trail Round Lake Heights, IL 60073
Estimated Value: $378,121 - $393,000
4
Beds
4
Baths
2,192
Sq Ft
$176/Sq Ft
Est. Value
About This Home
This home is located at 908 Seneca Trail, Round Lake Heights, IL 60073 and is currently estimated at $386,780, approximately $176 per square foot. 908 Seneca Trail is a home located in Lake County with nearby schools including Olive C Martin School, Palombi Middle School, and Grant Community High School.
Ownership History
Date
Name
Owned For
Owner Type
Purchase Details
Closed on
Jun 13, 2006
Sold by
Rodriguez Hector and Lopez Luz Pilar
Bought by
Fernandez Ramon and Fernandez Reyna
Current Estimated Value
Home Financials for this Owner
Home Financials are based on the most recent Mortgage that was taken out on this home.
Original Mortgage
$162,000
Outstanding Balance
$96,832
Interest Rate
6.87%
Mortgage Type
Purchase Money Mortgage
Estimated Equity
$289,948
Purchase Details
Closed on
May 3, 2004
Sold by
Rodriguez Hector
Bought by
Rodriguez Hector and Lopez Luz Pilar
Purchase Details
Closed on
Mar 29, 2002
Sold by
Neumann Homes Inc
Bought by
Rodriguez Hector H
Home Financials for this Owner
Home Financials are based on the most recent Mortgage that was taken out on this home.
Original Mortgage
$182,900
Interest Rate
7%
Create a Home Valuation Report for This Property
The Home Valuation Report is an in-depth analysis detailing your home's value as well as a comparison with similar homes in the area
Home Values in the Area
Average Home Value in this Area
Purchase History
| Date | Buyer | Sale Price | Title Company |
|---|---|---|---|
| Fernandez Ramon | $262,000 | Republic Title Company | |
| Rodriguez Hector | -- | -- | |
| Rodriguez Hector H | $193,000 | Chicago Title Insurance Co |
Source: Public Records
Mortgage History
| Date | Status | Borrower | Loan Amount |
|---|---|---|---|
| Open | Fernandez Ramon | $162,000 | |
| Previous Owner | Rodriguez Hector H | $182,900 |
Source: Public Records
Tax History Compared to Growth
Tax History
| Year | Tax Paid | Tax Assessment Tax Assessment Total Assessment is a certain percentage of the fair market value that is determined by local assessors to be the total taxable value of land and additions on the property. | Land | Improvement |
|---|---|---|---|---|
| 2024 | $8,497 | $107,359 | $15,999 | $91,360 |
| 2023 | $7,773 | $94,857 | $14,136 | $80,721 |
| 2022 | $7,773 | $83,152 | $13,218 | $69,934 |
| 2021 | $7,416 | $77,243 | $12,279 | $64,964 |
| 2020 | $7,400 | $74,769 | $11,886 | $62,883 |
| 2019 | $7,584 | $71,858 | $11,423 | $60,435 |
| 2018 | $6,518 | $62,109 | $13,560 | $48,549 |
| 2017 | $6,481 | $60,452 | $13,198 | $47,254 |
| 2016 | $6,669 | $58,005 | $12,664 | $45,341 |
| 2015 | $6,382 | $54,175 | $11,828 | $42,347 |
| 2014 | $6,167 | $55,147 | $10,812 | $44,335 |
| 2012 | $6,976 | $55,413 | $10,864 | $44,549 |
Source: Public Records
Map
Nearby Homes
- 2292 Iroquois Ln
- 862 Chesapeake Trail
- 2146 Prairie Trail
- 686 Chippewa Cir
- 24570 W Blackcherry Ln
- 411 Red Cedar Rd Unit I
- 535 Normandie Ln
- 527 Normandie Ln
- 908 Flintwood Ct
- 1813 Tomahawk Trail
- 2033 Westview Ln Unit 5
- 1993 Westview Ln
- 2011 Westview Ln
- 512 Meadow Hill Ln
- 1724 Lotus Dr
- 933 Tomahawk Trail
- 930 N Fairfield Rd
- 24731 W Orchard Place
- 330 Greenview Ln
- 446 Meadow Green Ln Unit 8
- 900 Seneca Trail
- 909 Black Cherry Ln
- 890 Seneca Trail
- 901 Black Cherry Ln
- 2300 Prairie Trail
- 2312 Prairie Trail
- 2296 Prairie Trail
- 2322 Prairie Trail
- 891 Black Cherry Ln
- 909 Seneca Trail
- 880 Seneca Trail
- 899 Seneca Trail
- 2332 Prairie Trail
- 2284 Prairie Trail
- 889 Seneca Trail
- 881 Black Cherry Ln
- 870 Seneca Trail
- 945 Black Cherry Ln
- 2274 Prairie Trail
- 879 Seneca Trail