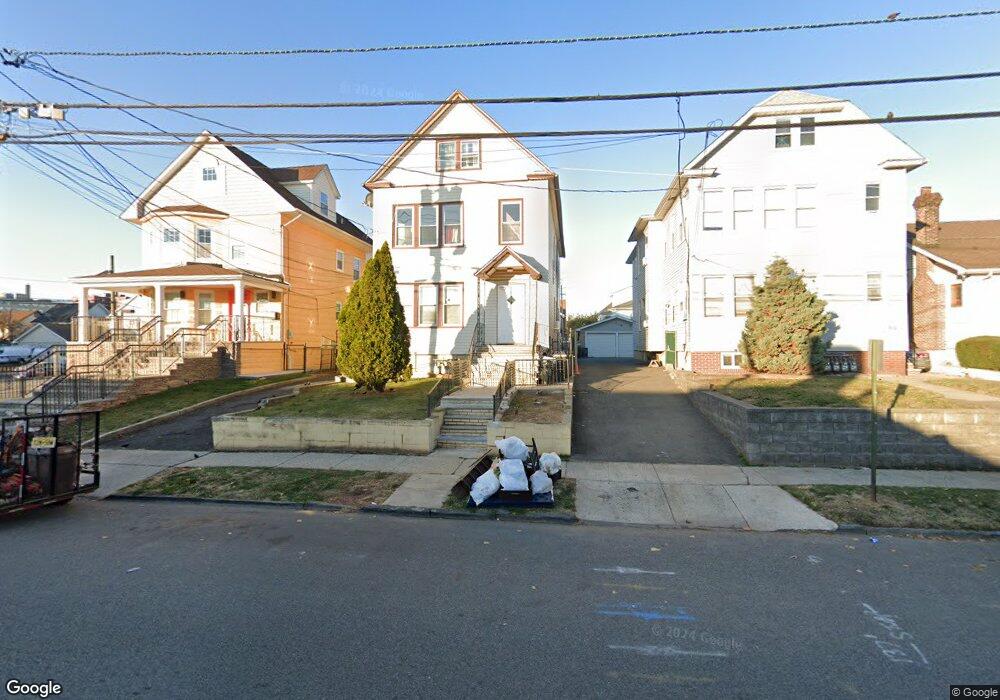
908 Sheridan Ave Unit 912 Elizabeth, NJ 07208
North End NeighborhoodEstimated Value: $481,367 - $846,000
--
Bed
--
Bath
2,944
Sq Ft
$235/Sq Ft
Est. Value
About This Home
This home is located at 908 Sheridan Ave Unit 912, Elizabeth, NJ 07208 and is currently estimated at $693,092, approximately $235 per square foot. 908 Sheridan Ave Unit 912 is a home located in Union County with nearby schools including Number 18, Robert Morris Elementary School, Elizabeth High School, and Bruriah High School For Girls.
Ownership History
Date
Name
Owned For
Owner Type
Purchase Details
Closed on
Mar 25, 2025
Sold by
Santos Michael
Bought by
Santos Michael and Fowler Regina Brannigan
Current Estimated Value
Purchase Details
Closed on
Jun 24, 2005
Sold by
Heaton Beth D
Bought by
Santos Michael
Home Financials for this Owner
Home Financials are based on the most recent Mortgage that was taken out on this home.
Original Mortgage
$278,668
Interest Rate
5.66%
Purchase Details
Closed on
Nov 1, 2001
Sold by
Correa Carlos
Bought by
Correa Jorge L and Correa Jorge L
Home Financials for this Owner
Home Financials are based on the most recent Mortgage that was taken out on this home.
Original Mortgage
$183,549
Interest Rate
6.6%
Mortgage Type
FHA
Create a Home Valuation Report for This Property
The Home Valuation Report is an in-depth analysis detailing your home's value as well as a comparison with similar homes in the area
Home Values in the Area
Average Home Value in this Area
Purchase History
| Date | Buyer | Sale Price | Title Company |
|---|---|---|---|
| Santos Michael | -- | Trident Abstract Title | |
| Santos Michael | -- | Trident Abstract Title | |
| Santos Michael | $289,000 | -- | |
| Correa Jorge L | $185,000 | -- |
Source: Public Records
Mortgage History
| Date | Status | Borrower | Loan Amount |
|---|---|---|---|
| Previous Owner | Santos Michael | $278,668 | |
| Previous Owner | Correa Jorge L | $183,549 |
Source: Public Records
Tax History Compared to Growth
Tax History
| Year | Tax Paid | Tax Assessment Tax Assessment Total Assessment is a certain percentage of the fair market value that is determined by local assessors to be the total taxable value of land and additions on the property. | Land | Improvement |
|---|---|---|---|---|
| 2025 | $12,633 | $656,600 | $189,000 | $467,600 |
| 2024 | $15,212 | $656,600 | $189,000 | $467,600 |
| 2023 | $15,212 | $48,400 | $9,800 | $38,600 |
| 2022 | $14,800 | $48,400 | $9,800 | $38,600 |
| 2021 | $14,495 | $48,400 | $9,800 | $38,600 |
| 2020 | $14,167 | $48,400 | $9,800 | $38,600 |
| 2019 | $13,951 | $48,400 | $9,800 | $38,600 |
| 2018 | $13,815 | $48,400 | $9,800 | $38,600 |
| 2017 | $13,430 | $48,400 | $9,800 | $38,600 |
| 2016 | $13,431 | $48,400 | $9,800 | $38,600 |
| 2015 | $12,632 | $48,400 | $9,800 | $38,600 |
| 2014 | $12,253 | $48,400 | $9,800 | $38,600 |
Source: Public Records
Map
Nearby Homes
- 904 Cross Ave
- 826 Cross Ave
- 1379 Garfield Place
- 1408 Lexington Place Unit 1410
- 1432 Lexington Place Unit 1434
- 704 712 N Broad St Unit 8B
- 747 757 N Broad St Unit 301
- 111 Hanford St
- 13 Wharton St
- 712 N Broad St Unit 2E
- 712 N Broad St Unit 2A
- 20-22 Garibaldi Ave
- 704-712 N Broad St Unit 3D
- 28 Garibaldi Ave
- 71 Georgian Ct
- 660-672 N Broad St Unit 20 A
- 660-672 N Broad St Unit b19
- 660 N Broad St Unit 20 A
- 730 Salem Ave
- 33-35 Evergreen Ave
- 912 Sheridan Ave Unit 4
- 906 Sheridan Ave Unit 8
- 900 Sheridan Ave Unit 904
- 916 Sheridan Ave Unit 918
- 911 Kilsyth Rd Unit 913
- 918 Sheridan Ave Unit 920
- 915 Kilsyth Rd
- 915 Kilsyth Rd
- 915 Kilsyth Rd Unit 2
- 915 Kilsyth Rd
- 913 Kilsyth Rd
- 917 Kilsyth Rd Unit 919
- 907 Kilsyth Rd Unit 9
- 922 Sheridan Ave Unit 4
- 903 Kilsyth Rd Unit 905
- 901 Kilsyth Rd Unit 903
- 901-903 Kilsyth Rd
- 919 Kilsyth Rd Unit 921
- 924 Sheridan Ave Unit 6
- 0 Sheridan Ave