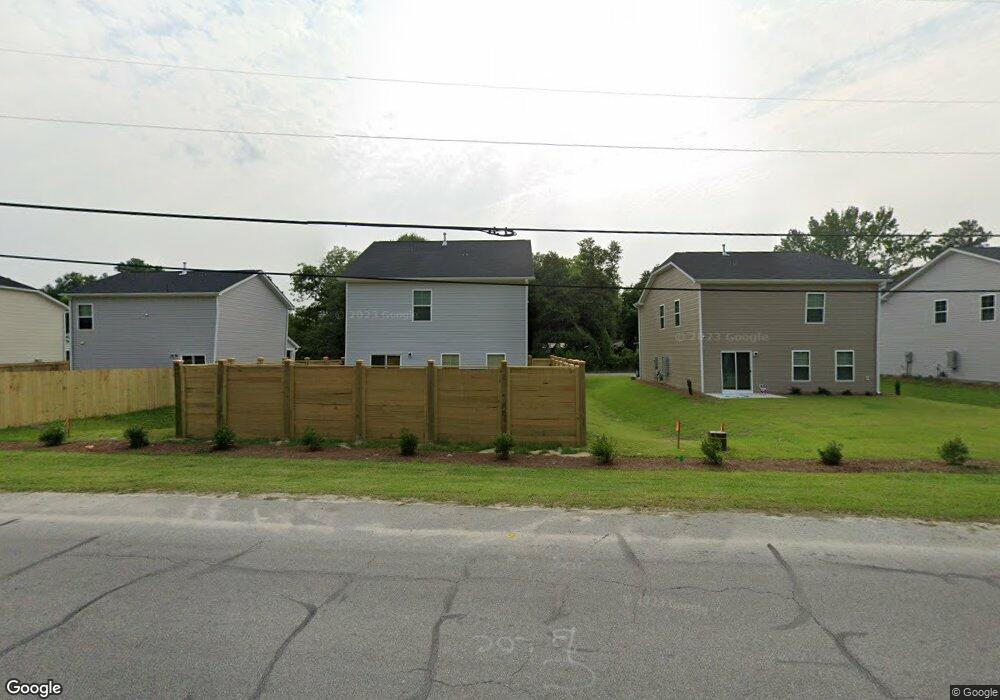
908 Sox St West Columbia, SC 29169
Estimated Value: $199,000
3
Beds
1
Bath
888
Sq Ft
$224/Sq Ft
Est. Value
About This Home
This home is located at 908 Sox St, West Columbia, SC 29169 and is currently priced at $199,000, approximately $224 per square foot. 908 Sox St is a home located in Lexington County with nearby schools including Cayce Elementary, Cyril B. Busbee Creative Arts Academy, and Brookland-Cayce High School.
Ownership History
Date
Name
Owned For
Owner Type
Purchase Details
Closed on
Mar 24, 2023
Sold by
Mak Investments Llc
Bought by
Mcguinn Homes Llc
Current Estimated Value
Home Financials for this Owner
Home Financials are based on the most recent Mortgage that was taken out on this home.
Original Mortgage
$967,600
Outstanding Balance
$938,246
Interest Rate
6.32%
Mortgage Type
New Conventional
Purchase Details
Closed on
Jan 10, 2022
Sold by
Steele Marion F and Estate Of Ellen W Steele
Bought by
Mak Investments Llc
Purchase Details
Closed on
Nov 16, 2017
Sold by
Steele Ellen W
Bought by
Lowry Ernest B
Home Financials for this Owner
Home Financials are based on the most recent Mortgage that was taken out on this home.
Original Mortgage
$79,540
Interest Rate
3.88%
Mortgage Type
New Conventional
Create a Home Valuation Report for This Property
The Home Valuation Report is an in-depth analysis detailing your home's value as well as a comparison with similar homes in the area
Home Values in the Area
Average Home Value in this Area
Purchase History
| Date | Buyer | Sale Price | Title Company |
|---|---|---|---|
| Mcguinn Homes Llc | $231,000 | -- | |
| Mak Investments Llc | $150,000 | None Available | |
| Lowry Ernest B | $820,000 | None Available |
Source: Public Records
Mortgage History
| Date | Status | Borrower | Loan Amount |
|---|---|---|---|
| Open | Mcguinn Homes Llc | $967,600 | |
| Previous Owner | Lowry Ernest B | $79,540 |
Source: Public Records
Tax History Compared to Growth
Tax History
| Year | Tax Paid | Tax Assessment Tax Assessment Total Assessment is a certain percentage of the fair market value that is determined by local assessors to be the total taxable value of land and additions on the property. | Land | Improvement |
|---|---|---|---|---|
| 2023 | $0 | $2,496 | $2,328 | $168 |
| 2022 | $935 | $2,496 | $2,328 | $168 |
| 2020 | $886 | $2,496 | $2,328 | $168 |
| 2019 | $978 | $2,730 | $2,562 | $168 |
| 2018 | $970 | $2,730 | $2,562 | $168 |
| 2017 | $1,934 | $5,546 | $3,324 | $2,222 |
| 2016 | $1,957 | $5,546 | $3,324 | $2,222 |
| 2014 | $1,832 | $5,983 | $3,326 | $2,657 |
| 2013 | -- | $5,980 | $3,330 | $2,650 |
Source: Public Records
Map
Nearby Homes
- 1210 Decatur St
- 2024 Platt Springs Rd
- 706 Westside Dr
- 2312 Rainbow Dr
- 826 Jefferson St
- 2405 Rainbow Dr
- 725 Brooks Ave
- 153 Cavendish Dr
- 151 Cavendish Dr
- 157 Cavendish Dr
- TBD Woodfield Jupiter & Daisey Track
- Oak Plan at Faith Hills
- 0 Highway 302 Hwy Unit 589442
- 309 Hammond Ave
- 1832 Wadsworth Dr
- 1802 D Ave
- 212 Alexandria St
- 1409 Hazel St
- 1414 Hazel St
- 1608 Crapps Ave