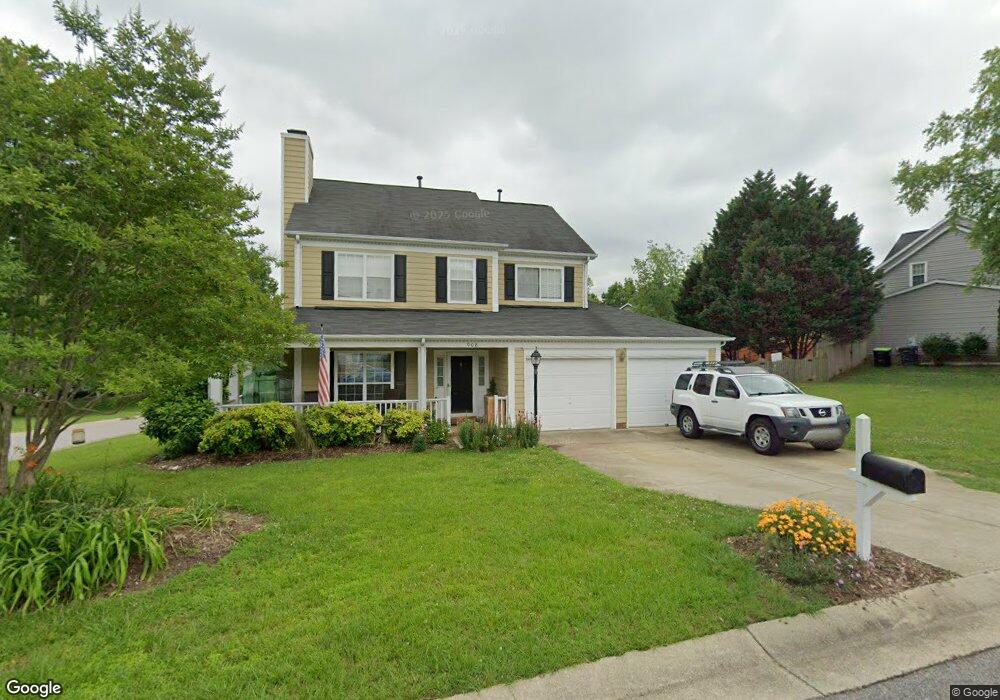
908 Starkland Way Holly Springs, NC 27540
Estimated Value: $376,000 - $395,000
3
Beds
3
Baths
1,410
Sq Ft
$271/Sq Ft
Est. Value
About This Home
This home is located at 908 Starkland Way, Holly Springs, NC 27540 and is currently estimated at $382,230, approximately $271 per square foot. 908 Starkland Way is a home located in Wake County with nearby schools including Oakview Elementary School, Apex Friendship Middle School, and Holly Springs High School.
Ownership History
Date
Name
Owned For
Owner Type
Purchase Details
Closed on
Dec 2, 2014
Sold by
Giordano Jennifer E and Giordano David P
Bought by
Jackson Charlotte B and Jackson Timothy S
Current Estimated Value
Home Financials for this Owner
Home Financials are based on the most recent Mortgage that was taken out on this home.
Original Mortgage
$164,128
Outstanding Balance
$126,091
Interest Rate
4%
Mortgage Type
New Conventional
Estimated Equity
$256,139
Purchase Details
Closed on
Feb 18, 2002
Sold by
Lyons Raymond D and Pruitt Lyons Tonya M
Bought by
Giordano David P and Giordano Jennifer E
Home Financials for this Owner
Home Financials are based on the most recent Mortgage that was taken out on this home.
Original Mortgage
$139,056
Interest Rate
6.81%
Mortgage Type
FHA
Create a Home Valuation Report for This Property
The Home Valuation Report is an in-depth analysis detailing your home's value as well as a comparison with similar homes in the area
Home Values in the Area
Average Home Value in this Area
Purchase History
| Date | Buyer | Sale Price | Title Company |
|---|---|---|---|
| Jackson Charlotte B | $180,000 | None Available | |
| Giordano David P | $140,000 | -- |
Source: Public Records
Mortgage History
| Date | Status | Borrower | Loan Amount |
|---|---|---|---|
| Open | Jackson Charlotte B | $164,128 | |
| Previous Owner | Giordano David P | $139,056 |
Source: Public Records
Tax History Compared to Growth
Tax History
| Year | Tax Paid | Tax Assessment Tax Assessment Total Assessment is a certain percentage of the fair market value that is determined by local assessors to be the total taxable value of land and additions on the property. | Land | Improvement |
|---|---|---|---|---|
| 2025 | $3,098 | $357,663 | $115,000 | $242,663 |
| 2024 | $3,085 | $357,663 | $115,000 | $242,663 |
| 2023 | $2,504 | $230,314 | $50,000 | $180,314 |
| 2022 | $2,418 | $230,314 | $50,000 | $180,314 |
| 2021 | $2,373 | $230,314 | $50,000 | $180,314 |
| 2020 | $2,373 | $230,314 | $50,000 | $180,314 |
| 2019 | $2,216 | $182,513 | $50,000 | $132,513 |
| 2018 | $2,004 | $182,513 | $50,000 | $132,513 |
| 2017 | $1,932 | $182,513 | $50,000 | $132,513 |
| 2016 | $1,905 | $182,513 | $50,000 | $132,513 |
| 2015 | $1,733 | $163,234 | $35,000 | $128,234 |
| 2014 | $1,674 | $163,234 | $35,000 | $128,234 |
Source: Public Records
Map
Nearby Homes
- 717 Starkland Way
- 713 Littleleaf Ct
- 725 Little Leaf Ct
- 108 Crabwall Ct
- 105 Townsgate Ct
- 321 Blalock St
- 329 N Main St
- 318 Blalock St
- 109 Bright Shade Ct
- 225 Douglas St
- 124 Cliffdale Rd
- 112 Burt St
- 737 W Holly Springs Rd
- 743 W Holly Springs Rd
- 105 Cross Hill Ln
- 749 W Holly Springs Rd
- 755 W Holly Springs Rd
- 761 W Holly Springs Rd
- 321 Cross Hill Ln
- 112 Sanchez Ct
- 1009 Silverstone Way
- 904 Starkland Way
- 1005 Silverstone Way
- 913 Starkland Way
- 917 Starkland Way
- 1024 Silverstone Way
- 900 Starkland Way
- 1020 Silverstone Way
- 1001 Starkland Way
- 1001 Silverstone Way
- 1016 Silverstone Way
- 905 Starkland Way
- 804 Starkland Way
- 1012 Silverstone Way
- 100 Marleton Way
- 1005 Starkland Way
- 1000 Silverstone Way
- 116 Bracken Trail Cir
- 120 Bracken Trail Cir
- 112 Bracken Trail Cir