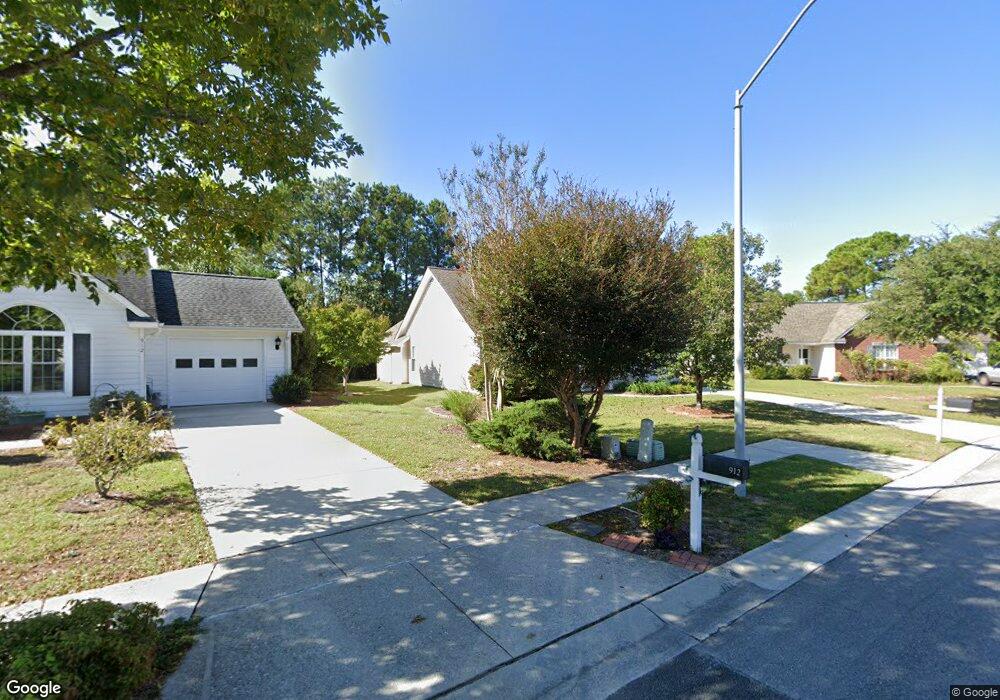
908 Taliga Ln Wilmington, NC 28412
Carriage Hills NeighborhoodEstimated Value: $340,000 - $379,754
3
Beds
2
Baths
1,380
Sq Ft
$266/Sq Ft
Est. Value
About This Home
This home is located at 908 Taliga Ln, Wilmington, NC 28412 and is currently estimated at $366,689, approximately $265 per square foot. 908 Taliga Ln is a home located in New Hanover County with nearby schools including Pine Valley Elementary School, Williston Middle School, and Eugene Ashley High School.
Ownership History
Date
Name
Owned For
Owner Type
Purchase Details
Closed on
Apr 12, 1999
Sold by
Spetrino Jon C Nichole S
Bought by
Siebold Judith J
Current Estimated Value
Purchase Details
Closed on
Jan 28, 1998
Sold by
Spetrino Jon C Nichole S
Bought by
Spetrino Jon C Nicole S
Purchase Details
Closed on
Jun 10, 1997
Sold by
Landmark Homes Inc
Bought by
Spetrino Jon C
Purchase Details
Closed on
Sep 4, 1996
Sold by
Landmark Homes Inc
Bought by
Fortress Landmark Inc
Purchase Details
Closed on
Aug 13, 1996
Sold by
Landmark Developers Inc
Bought by
Landmark Homes Inc
Purchase Details
Closed on
Feb 19, 1996
Sold by
Landmark Land & Timber Inc
Bought by
Landmark Developers Inc
Purchase Details
Closed on
Mar 22, 1991
Sold by
Landmark Organization Inc
Bought by
Landmark Land & Timber Inc
Purchase Details
Closed on
Jan 1, 1986
Sold by
Newkirk B W Jr Est
Bought by
Landmark Organization Inc
Create a Home Valuation Report for This Property
The Home Valuation Report is an in-depth analysis detailing your home's value as well as a comparison with similar homes in the area
Home Values in the Area
Average Home Value in this Area
Purchase History
| Date | Buyer | Sale Price | Title Company |
|---|---|---|---|
| Siebold Judith J | $131,000 | -- | |
| Spetrino Jon C Nicole S | -- | -- | |
| Spetrino Jon C | $123,000 | -- | |
| Fortress Landmark Inc | $7,566,500 | -- | |
| Landmark Homes Inc | -- | -- | |
| Landmark Developers Inc | -- | -- | |
| Landmark Land & Timber Inc | -- | -- | |
| Landmark Organization Inc | $1,200,000 | -- |
Source: Public Records
Tax History Compared to Growth
Tax History
| Year | Tax Paid | Tax Assessment Tax Assessment Total Assessment is a certain percentage of the fair market value that is determined by local assessors to be the total taxable value of land and additions on the property. | Land | Improvement |
|---|---|---|---|---|
| 2025 | $2,206 | $349,300 | $113,200 | $236,100 |
| 2023 | $2,206 | $253,600 | $96,400 | $157,200 |
| 2022 | $2,156 | $253,600 | $96,400 | $157,200 |
| 2021 | $2,170 | $253,600 | $96,400 | $157,200 |
| 2020 | $1,754 | $166,500 | $45,000 | $121,500 |
| 2019 | $1,754 | $166,500 | $45,000 | $121,500 |
| 2018 | $1,754 | $166,500 | $45,000 | $121,500 |
| 2017 | $1,754 | $166,500 | $45,000 | $121,500 |
| 2016 | $1,827 | $164,900 | $50,000 | $114,900 |
| 2015 | $1,746 | $164,900 | $50,000 | $114,900 |
| 2014 | $1,672 | $164,900 | $50,000 | $114,900 |
Source: Public Records
Map
Nearby Homes
- 928 Taliga Ln
- 1006 Ryans Ct
- 4117 Breezewood Dr Unit 204
- 4314 Jonathan Ct
- 1035 Summerlin Falls Ct
- 4109 Breezewood Dr Unit 104
- 4166 Breezewood Dr Unit 103
- 842 Ruffin St
- 4103 Breezewood Dr Unit 104
- 4142 Breezewood Dr Unit 201
- 4130 Breezewood Dr Unit 204
- 4140 Breezewood Dr Unit 103
- 819 Ruffin St
- 4432 Regent Dr
- 4414 Grey Oaks Ct
- 4422 Grey Oaks Ct
- 4126 Breezewood Dr Unit 101
- 3669 Merestone Dr
- 1155 Groppo Cove
- 3831 Merestone Dr