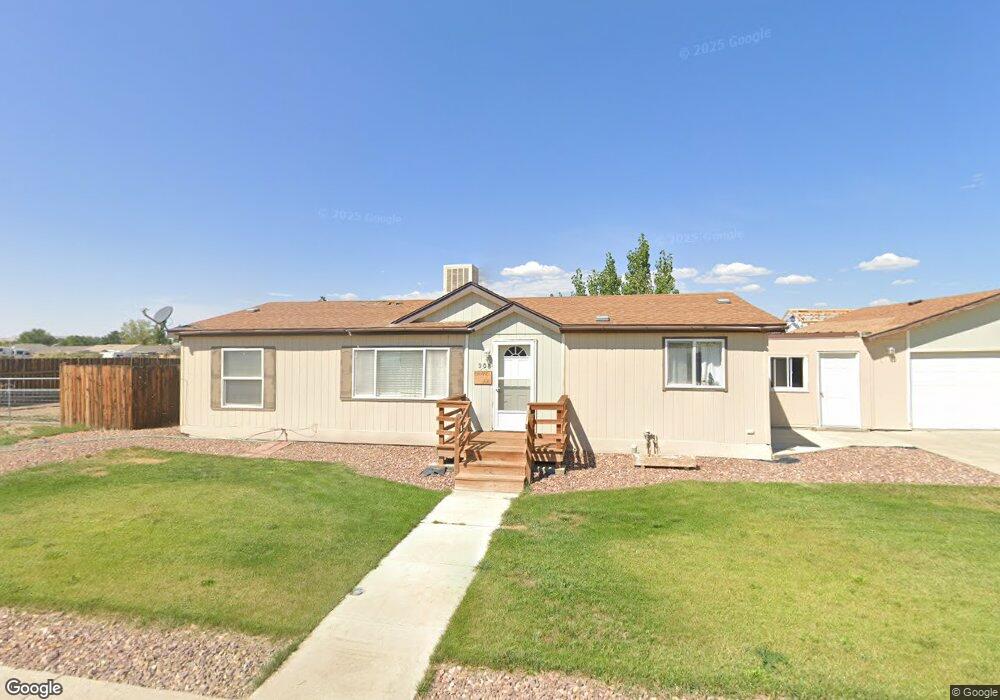
908 Tropic St Rangely, CO 81648
Estimated Value: $165,000 - $227,000
3
Beds
2
Baths
2,162
Sq Ft
$95/Sq Ft
Est. Value
About This Home
This home is located at 908 Tropic St, Rangely, CO 81648 and is currently estimated at $206,429, approximately $95 per square foot. 908 Tropic St is a home located in Rio Blanco County with nearby schools including Parkview Elementary School, Rangely Junior/Senior High School, and Rangely Christian Academy.
Ownership History
Date
Name
Owned For
Owner Type
Purchase Details
Closed on
May 21, 2015
Sold by
Dixon Nola G
Bought by
Drake Terry and Drake Kathleen
Current Estimated Value
Home Financials for this Owner
Home Financials are based on the most recent Mortgage that was taken out on this home.
Original Mortgage
$107,586
Outstanding Balance
$82,880
Interest Rate
3.68%
Mortgage Type
VA
Estimated Equity
$123,549
Purchase Details
Closed on
Mar 10, 2015
Sold by
Witte Brenda G
Bought by
Dixon Nola G
Purchase Details
Closed on
Feb 6, 2009
Sold by
Dixon Nola G
Bought by
Dixon Nola G and Whe Brenda G
Purchase Details
Closed on
May 3, 2005
Sold by
Town Of Rangely
Bought by
Dixon Kenneth B and Dixon Nola G
Home Financials for this Owner
Home Financials are based on the most recent Mortgage that was taken out on this home.
Original Mortgage
$55,000
Interest Rate
6.03%
Mortgage Type
Construction
Create a Home Valuation Report for This Property
The Home Valuation Report is an in-depth analysis detailing your home's value as well as a comparison with similar homes in the area
Home Values in the Area
Average Home Value in this Area
Purchase History
| Date | Buyer | Sale Price | Title Company |
|---|---|---|---|
| Drake Terry | $104,150 | None Available | |
| Dixon Nola G | -- | None Available | |
| Dixon Nola G | -- | None Available | |
| Dixon Kenneth B | $17,500 | None Available |
Source: Public Records
Mortgage History
| Date | Status | Borrower | Loan Amount |
|---|---|---|---|
| Open | Drake Terry | $107,586 | |
| Previous Owner | Dixon Kenneth B | $55,000 |
Source: Public Records
Tax History
| Year | Tax Paid | Tax Assessment Tax Assessment Total Assessment is a certain percentage of the fair market value that is determined by local assessors to be the total taxable value of land and additions on the property. | Land | Improvement |
|---|---|---|---|---|
| 2024 | $856 | $6,740 | $1,090 | $5,650 |
| 2023 | $566 | $6,740 | $1,090 | $5,650 |
| 2022 | $671 | $9,190 | $1,700 | $7,490 |
| 2021 | $674 | $9,190 | $1,700 | $7,490 |
| 2020 | $51 | $9,320 | $1,550 | $7,770 |
| 2019 | $625 | $9,320 | $1,550 | $7,770 |
| 2018 | $612 | $9,770 | $1,630 | $8,140 |
| 2017 | $682 | $9,770 | $1,630 | $8,140 |
| 2016 | $739 | $11,020 | $1,670 | $9,350 |
| 2015 | $544 | $10,160 | $0 | $0 |
| 2014 | $544 | $9,840 | $0 | $0 |
| 2013 | -- | $9,840 | $0 | $0 |
| 2012 | -- | $9,450 | $1,190 | $8,260 |
Source: Public Records
Map
Nearby Homes
- 203 Dakota Ave
- 1100 Tanglewood Ln
- 302 W Main St
- 115 S Jones Ave
- 206 E Rangely Ave
- 243 Crest St
- 251 E Raven Ave
- 515 Lake St
- 1215 La Mesa Cir
- 1235 La Mesa Cir
- 1225 La Mesa Cir
- 1210 La Mesa Cir
- 1542 La Mesa Cir
- 1250 Deserado Dr
- 1351 La Mesa Cir
- 0 County Road 101
- 0 Tbd Highway 40
- 0 Cr 104
- 0 3rd St Unit 10-12
- 801 Blue Mountain Ave
Your Personal Tour Guide
Ask me questions while you tour the home.