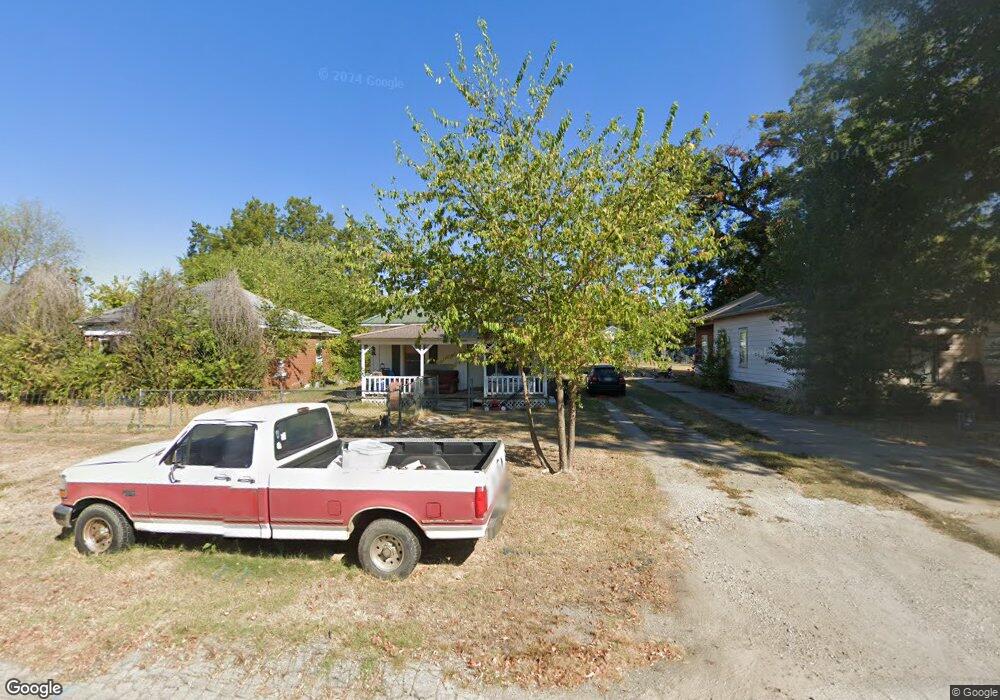
908 W Moore St Henryetta, OK 74437
Estimated Value: $49,891 - $65,000
2
Beds
1
Bath
988
Sq Ft
$56/Sq Ft
Est. Value
About This Home
This home is located at 908 W Moore St, Henryetta, OK 74437 and is currently estimated at $55,723, approximately $56 per square foot. 908 W Moore St is a home located in Okmulgee County with nearby schools including Henryetta Elementary School, Henryetta Middle School, and Henryetta High School.
Ownership History
Date
Name
Owned For
Owner Type
Purchase Details
Closed on
Aug 12, 2016
Sold by
Harmon Sammie and Harmon Michelle
Bought by
Ditech Financial Llc
Current Estimated Value
Purchase Details
Closed on
May 6, 2007
Sold by
Swartz & Brough Inc
Bought by
Harmon Sammie and Harmon Michelle
Home Financials for this Owner
Home Financials are based on the most recent Mortgage that was taken out on this home.
Original Mortgage
$26,900
Interest Rate
6.16%
Mortgage Type
Future Advance Clause Open End Mortgage
Purchase Details
Closed on
Nov 27, 2006
Sold by
Sisson James Erick and Sisson Annette
Bought by
Swartz & Brough Inc
Purchase Details
Closed on
Apr 24, 2003
Sold by
Bank One
Bought by
Sission James Erick
Purchase Details
Closed on
Sep 29, 1998
Sold by
Palmer Martin and Palmer Pamela
Bought by
Rowe Michael and Mary Lee
Purchase Details
Closed on
Apr 1, 1995
Sold by
Jackie Wallace
Bought by
Martin Palmer
Create a Home Valuation Report for This Property
The Home Valuation Report is an in-depth analysis detailing your home's value as well as a comparison with similar homes in the area
Home Values in the Area
Average Home Value in this Area
Purchase History
| Date | Buyer | Sale Price | Title Company |
|---|---|---|---|
| Ditech Financial Llc | $16,667 | None Available | |
| Harmon Sammie | $30,000 | None Available | |
| Swartz & Brough Inc | $17,500 | None Available | |
| Sission James Erick | $13,500 | -- | |
| Rowe Michael | $14,000 | -- | |
| Martin Palmer | $8,000 | -- |
Source: Public Records
Mortgage History
| Date | Status | Borrower | Loan Amount |
|---|---|---|---|
| Previous Owner | Harmon Sammie | $26,900 |
Source: Public Records
Tax History
| Year | Tax Paid | Tax Assessment Tax Assessment Total Assessment is a certain percentage of the fair market value that is determined by local assessors to be the total taxable value of land and additions on the property. | Land | Improvement |
|---|---|---|---|---|
| 2025 | $270 | $2,500 | $252 | $2,248 |
| 2024 | $240 | $2,381 | $252 | $2,129 |
| 2023 | $232 | $2,381 | $252 | $2,129 |
| 2022 | $287 | $2,927 | $252 | $2,675 |
| 2021 | $291 | $2,927 | $252 | $2,675 |
| 2020 | $290 | $2,927 | $252 | $2,675 |
| 2019 | $287 | $2,927 | $252 | $2,675 |
| 2018 | $288 | $2,927 | $252 | $2,675 |
| 2017 | $290 | $2,943 | $252 | $2,691 |
| 2016 | $131 | $2,328 | $252 | $2,076 |
| 2015 | $129 | $2,627 | $252 | $2,375 |
| 2014 | $209 | $3,600 | $252 | $3,348 |
Source: Public Records
Map
Nearby Homes
- 803 W Moore St
- 909 W Ragan St
- 1209 W Ragan St
- 104500 S 4095 Rd
- 802 W Gentry St
- 2201 W Main St
- 205 W Ragan St
- 303 W Cummings St
- 1215 Wade Wells Dr
- 512 N 4th St
- 205 W Washington St
- 201 E Main St
- 906 N 14th St
- 112 W Merrick St
- 214 N B St
- 318 E Trudgeon St
- 608 Pine St
- 612 NE 1st St
- 0 E Corporation St
- 202 E John St
- 906 W Moore St
- 910 W Moore St
- 904 W Moore St
- 912 W Moore St
- 902 W Moore St
- 209 S 9th St
- 907 W Broadway St
- 905 W Broadway St
- 909 W Broadway St
- 911 W Broadway St
- 907 W Moore St
- 901 W Broadway St
- 905 W Moore St
- 302 S 10th St
- 903 W Moore St
- 1004 W Moore St
- 901 W Moore St
- 208 S 9th St
- 1001 W Broadway St
- 823 W Broadway St
Your Personal Tour Guide
Ask me questions while you tour the home.